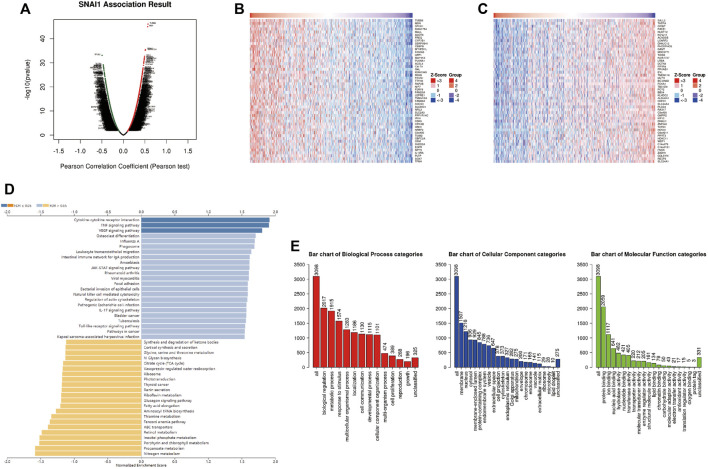
FIGURE 4.
Analysis of differentially expressed genes (DEGs) in correlation with SNAI1 in breast cancer (A) Volcano plot showing the up- and downregulated genes correlated with SNAI1 expression (Pearson test). Significantly positively correlated (B) and negatively correlated (C) genes are shown in heatmaps (D) Kyoto Encyclopedia Genes and Genomes (KEGG) pathway analysis of the significant DEGs in correlation with SNAI1 (E) Gene ontology (GO) analysis of the significant DEGs in correlation with SNAI1.

