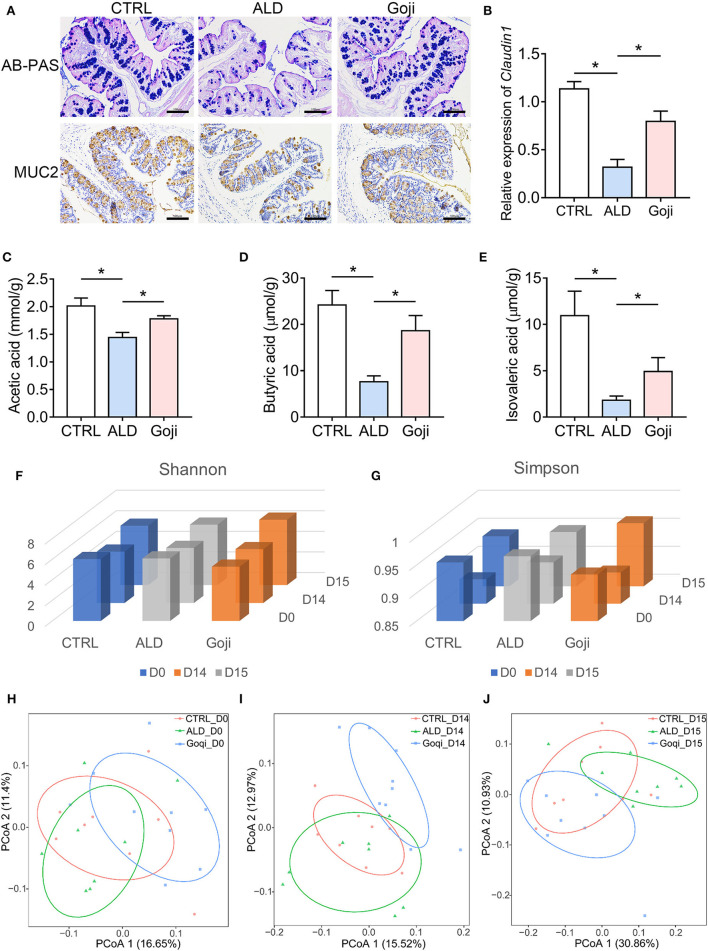
Figure 2.
Goji maintained the gut microenvironment and modulated the overall structure of gut microbiota. (A) AB–PAS staining and immunohistochemical analysis of the expression of MUC2 of colon section. Scale bars, 100 μm. (B) The relative expression of Claudin1 in the colon. (C) quantification of cecal acetic acid. (D) quantification of butyric acid. (E) quantification of isovaleric acid. (F) Shannon index of microbiota; (G) Simpson index of microbiota. (H) principal-coordinate analysis (PCoA) plot at D0 based on unweighted UniFrac distance. Each point represents each sample. (I) PCoA plot at D14. (J) PCoA plot at D15. F–J, n = 8. Data are shown as mean ± SEM, and statistical significance is assessed by one-way ANOVA corrected for multiple comparison by Tukey's test. *p-value < 0.05.

