Figure 3.
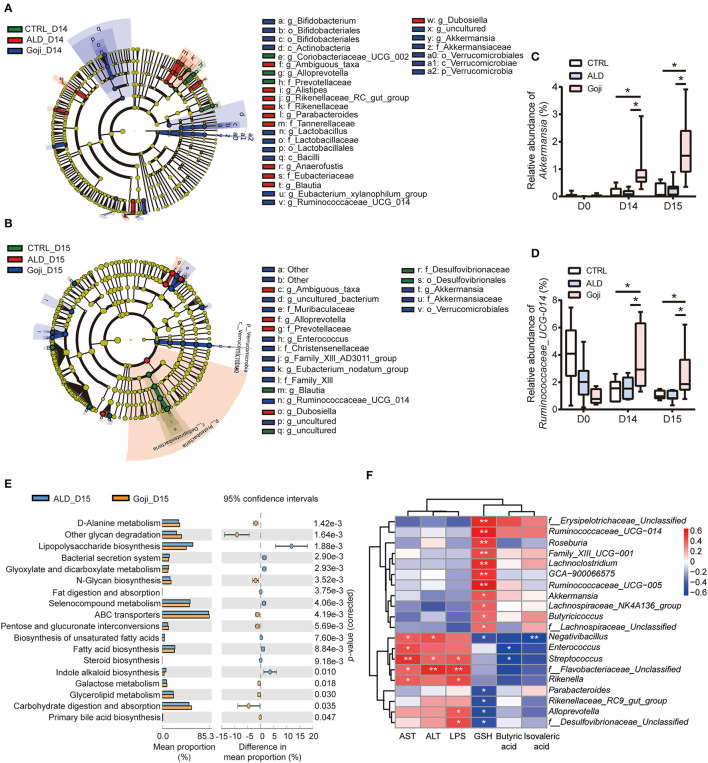
Significantly different taxa between experimental groups and prediction of metabolic function. (A) LEfSe taxonomic cladograms are processed to identify specific taxa at different levels after Goji pretreatment for 14 days (D14). (B) specific taxa between CTRL, ALD, and Goji groups after alcohol shock at D15. Significantly discriminant taxon nodes are colored, and branch areas are shaded according to the effect size of taxa. Green taxa enriched in CTRL group; Red taxa enriched in ALD group; Blue taxa enriched in Goji group. Only the taxon whose LDA score >3 is displayed. The species with no significant difference were colored yellow. Prefixes represent abbreviations for a taxonomic rank of each taxon, with phylum (p), class (c), order (o), family (f), and genus (g). (C) relative abundance of Akkermansia. (D) relative abundance of Ruminococcaceae_UCG_014. Data are shown as mean ± SEM (n = 7–8), and statistical significance assessed by one-way ANOVA corrected for multiple comparison by Tukey's test. (E) significant differences in metabolism pathway between ALD and Goji at Day 15. P-values were calculated using Welch's test. (F) the Spearman's correlation between the liver-related index and the relative abundance of significantly different genera. The scale represents the correlation coefficients. *p-value < 0.05, **p-value < 0.01.

