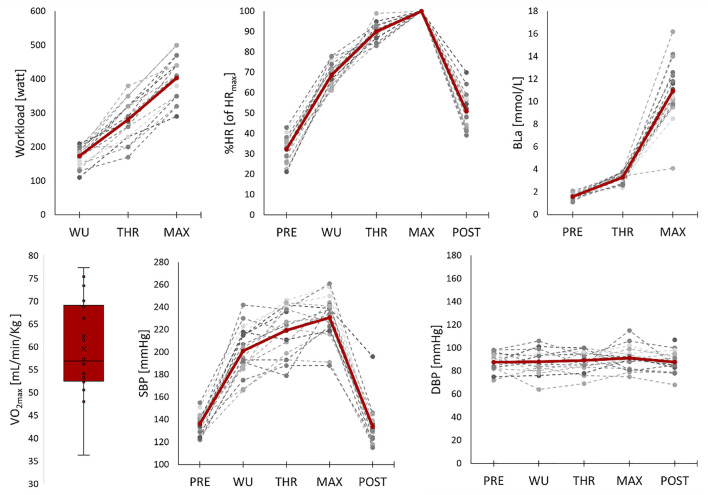
FIGURE 2.
VO2max is presented as a box and whisker plot with median, interquartile range, and minimum and maximum value, otherwise Individual (dotted lines) and mean (red line) values for workload, percentage of maximal heart rate (%HR), blood lactate (BLa), systolic blood pressure (SBP) and diastolic blood pressure (DBP) during the protocol. PRE = values at rest before the cycling, WU = values during warm-up, THR = values at the threshold, MAX = values at maximal intensity (except for BLa which was measured directly after the maximal intensity), POST = values measured 10 min after the test.

