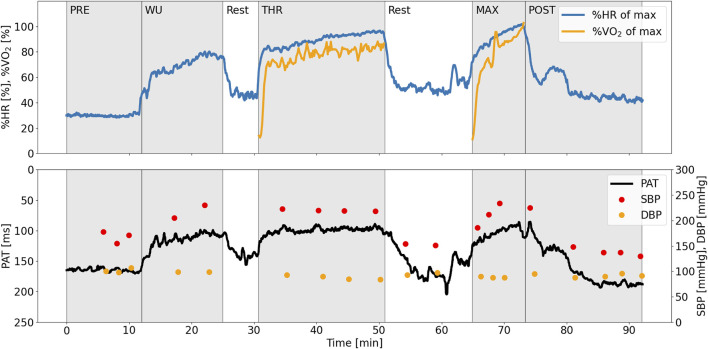
FIGURE 3.
Physiological measurements during the experimental protocol, exemplified with data from one typical subject. PAT is inverted on the y-axis to better visualize the co-variation with SBP. PAT, pulse arrival time (ms); SBP, systolic blood pressure (mmHg); DBP, diastolic blood pressure (mmHg); HR, heart rate (beats per minute).

