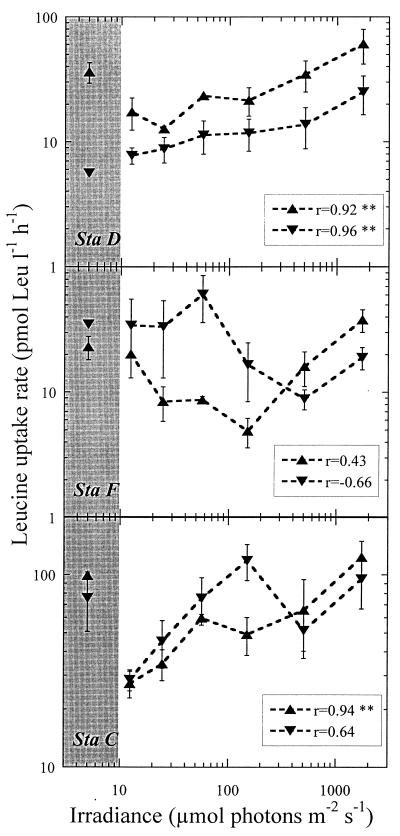
FIG. 2.
Plots of leucine uptake versus irradiance for the three stations sampled during the day. Water was taken from depths of 5 m (▴) and 40 m (▾). The points included in the shaded area correspond to dark bottles. Error bars represent standard errors. The coefficients of correlation between both variables are given, with the level of significance indicated as follows: no asterisk, P > 0.05; ∗, P < 0.05; ∗∗, P < 0.01.

