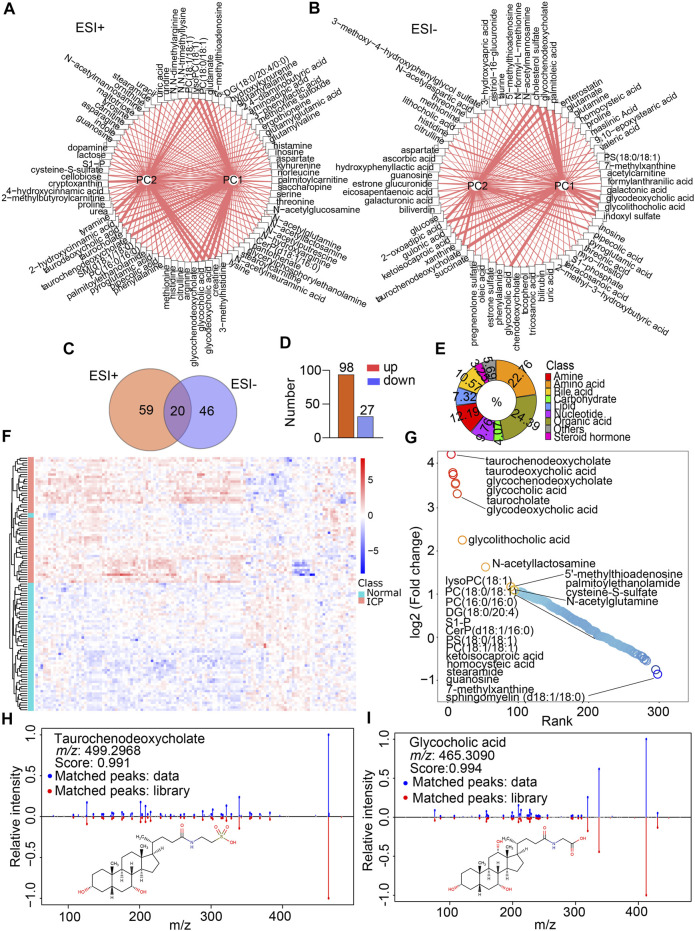
FIGURE 3.
Metabolite annotation and differential metabolite screenings. (A,B) Network analysis of the VIP score of each differential metabolite according to the contribution for PC1 and PC2 in the ESI+ and ESI- modes, respectively. Width of lines represents the VIP scores. (C) Venn diagram indicates the shared and non-shared metabolites in the normal and ICP groups. (D) Increased and decreased metabolites in the ICP group. (E) Classification of metabolites by their properties. (F) Heatmap visualizes the differential metabolites’ signal intensities, the column represents the samples, and the row represents the metabolites. The red and blue denote the increased and decreased metabolites in the ICP group, respectively. (G) Rank plots show the top increased (red) and decreased (blue) metabolites in the ICP group. (H,I) MS/MS spectral fragments of typical metabolites (glycocholic acid and taurochenodeoxycholate) are confirmed by matching the standard library.

