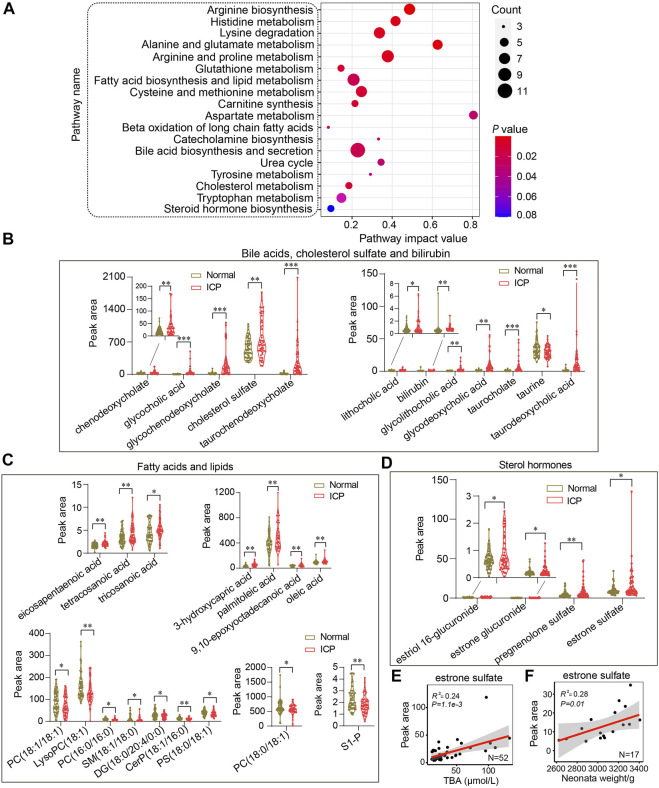
FIGURE 5.
System-wide analysis of the metabolic pathways of ICP patients. (A) Metabolic pathway analysis of differential metabolites by using MetaboAnalyst. The size of the nodes shows the number of matched metabolites, the color of the nodes represents p value of the enrichment analysis. (B–D) Quantitative analysis of bile acids, cholesterol sulfate, bilirubin; fatty acids, lipids, and sterol hormones in the two groups, respectively. The Mann–Whitney U test is performed, * p < 0.05, ** p < 0.01 vs. controls. (E,F) Pearson correlation analysis of estrone sulfate with TBA and neonatal weights in ICP patients, respectively. The 95% confidence interval for the linear regression is represented by the gray area.

