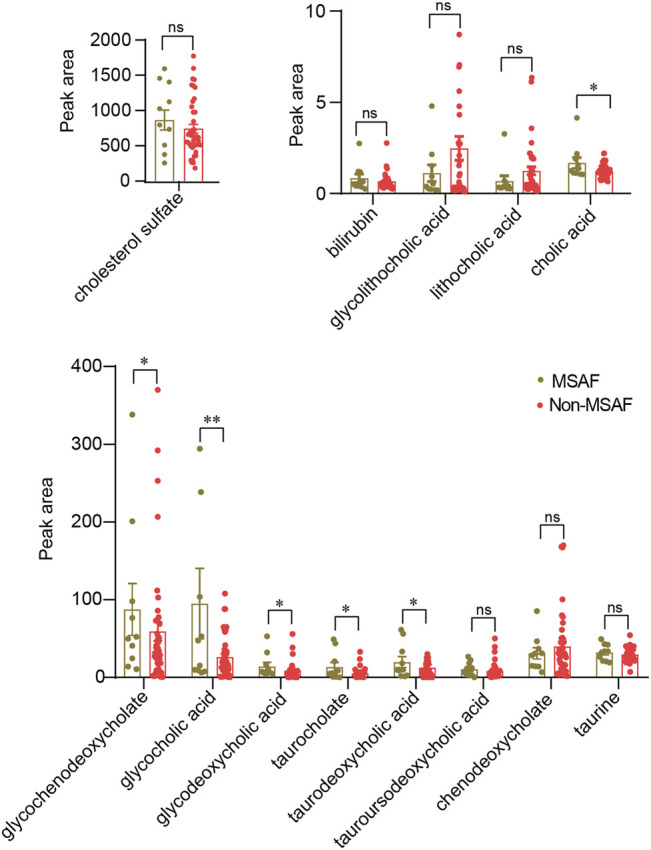
FIGURE 6.

Quantitative analysis of the bile acid levels in the MSAF group and the non-MSAF group. Values representing the mean ± SEM, p values are presented with * p < 0.05, ** p < 0.01 vs. controls, respectively. ns, non-significant; MSAF, meconium-stained amniotic fluid; Non-MSAF, Non-meconium-stained amniotic fluid.
