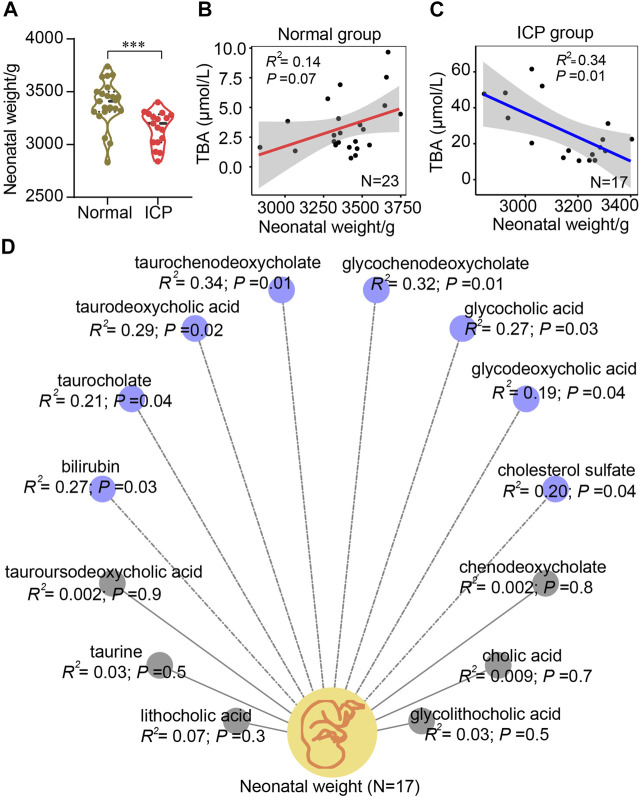
FIGURE 7.
Pearson correlation analysis of bile acids and neonatal birthweights. (A) Quantitative analysis of neonatal weights in natural delivery control and the ICP group. Values representing the mean ± SEM, p values are presented with *** p < 0.001 vs. controls. (B,C) Correlation analysis of bile acids and neonatal weights in the two groups, respectively. (D) Correlation analysis of each bile acid and neonatal weight in ICP patients with a normal delivery according to the mass spectrometric data, respectively. Blue (dotted lines) and gray (solid lines) circles represent negative and no correlations, respectively. The 95% confidence interval for the linear regression is represented by the gray area.

