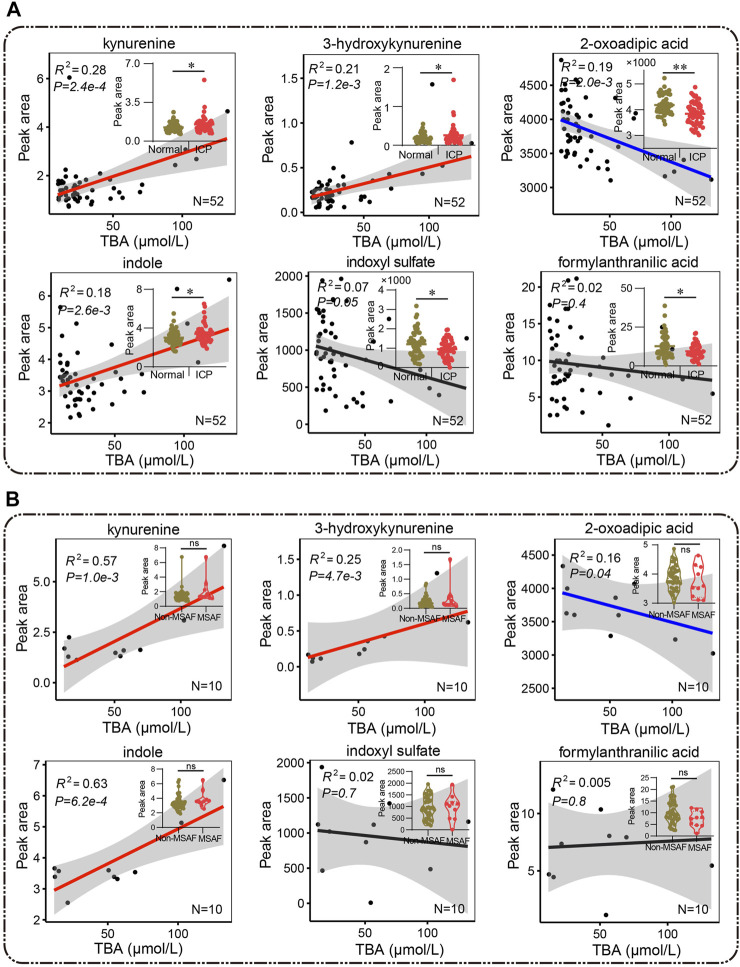
FIGURE 8.
(A,B) Pearson correlation analysis between metabolites of the tryptophan pathway and bile acid. Red and blue lines represent positive and negative correlations, and the black lines show no correlation, respectively. (A) The Mann–Whitney U test and (B) the unpaired Student’s t-test are performed respectively, * p < 0.05, ** p < 0.01 vs. controls. ns, non-significant; MSAF, meconium-stained amniotic fluid; Non-MSAF, Non-meconium-stained amniotic fluid.

