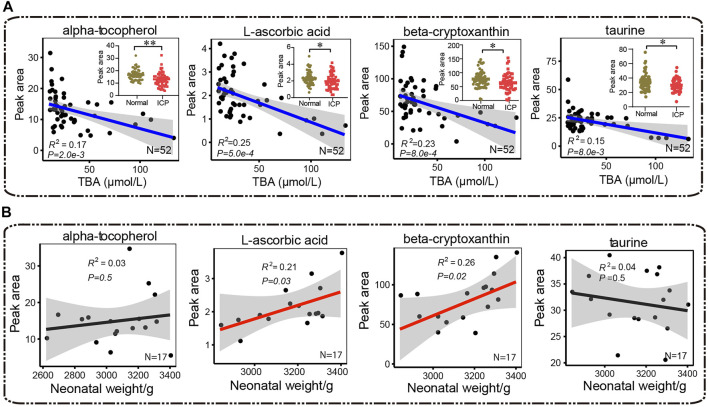
FIGURE 9.
Pearson correlation analysis between antioxidants (α-tocopherol, L-ascorbic acid, β-cryptoxanthin, and taurine) and (A) total bile acids and (B) neonatal weights, respectively. Red and blue lines represent positive and negative correlations, and the black lines show no correlation, respectively. The 95% confidence interval for the linear regression is represented by the gray area. The Mann–Whitney U test is performed, * p < 0.05, ** p < 0.01 vs. control, respectively.

