
FIGURE 6.
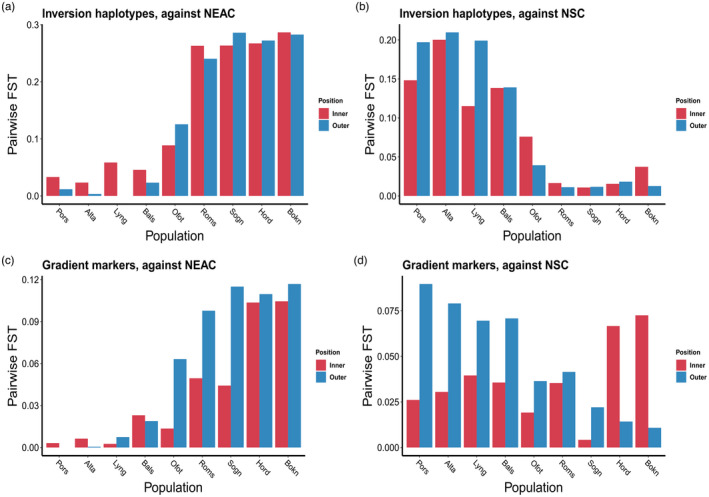
Pairwise F ST values between CC samples and the reference samples of NEAC. The analysis was only performed on pairs of inner and corresponding outer‐fjord samples
Official websites use .gov
A
.gov website belongs to an official
government organization in the United States.
Secure .gov websites use HTTPS
A lock (
) or https:// means you've safely
connected to the .gov website. Share sensitive
information only on official, secure websites.
Pairwise F ST values between CC samples and the reference samples of NEAC. The analysis was only performed on pairs of inner and corresponding outer‐fjord samples