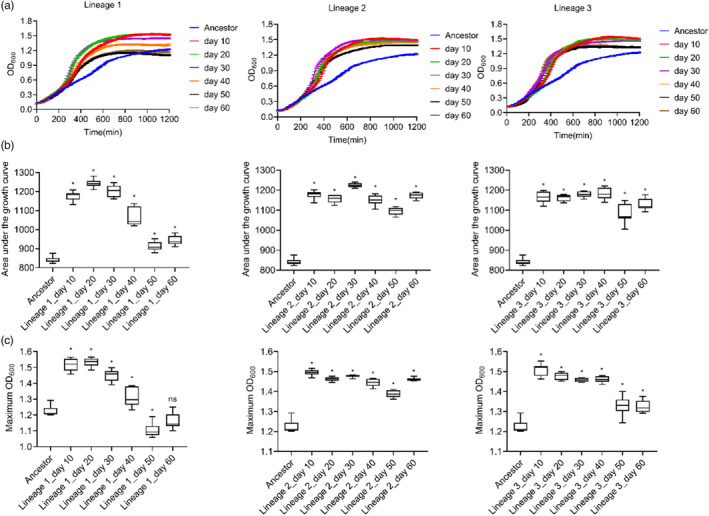
FIGURE 2.

Fitness of evolving populations at 6 time points from lineage 1, 2, and 3. The growth curve (a), the area under the curve (b), and the maximum OD600 (c) of each population were compared with the same data of ancestral strain ATCC 17978/pAZJ221 in imipenem‐containing MH broth. Data were collected for 20 h at 37 °C with shaking. Statistical analysis was performed through Dunnett's multiple comparisons test with Dunnett's T3 multiple comparisons test for unequal variances. *, adjusted p value < 0.05; ns, not statistically significant
