
FIGURE 5.
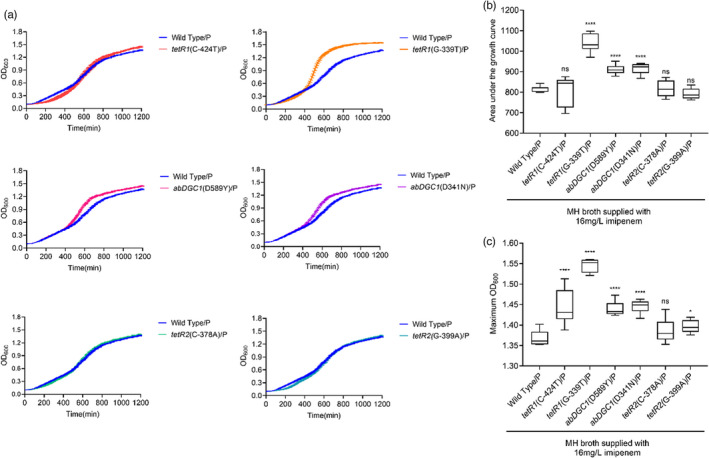
Growth curve (a), the area under the curve (b), and the maximum OD600 (c) of the ancestor strain ATCC 17978/pAZJ221 and 6 mutants with pAZJ221 were assayed in their evolved environment where 16 mg/L imipenem was supplied in MH broth. Box plots show median, lower, and upper quartiles, the minimum value, and the maximum value. Data were collected for 20 h at 37°C with shaking. Statistical analysis was performed through Dunnett's multiple comparisons test. *, adjusted p value < 0.05; ****, adjusted p value < 0.0001; ns, not statistically significant. P, pAZJ221; Wild Type/P, ATCC 17978/pAZJ221