
FIGURE 6.
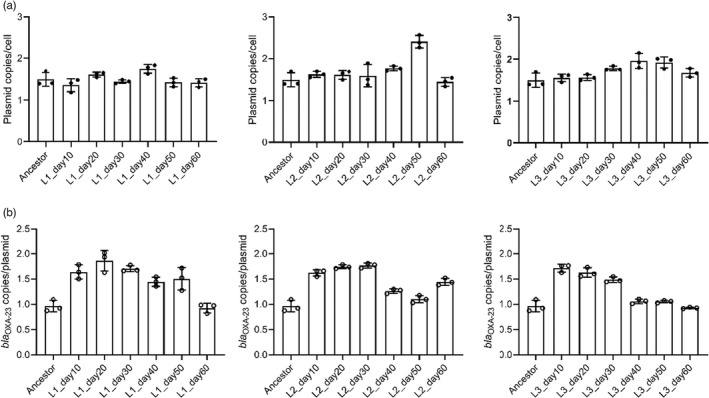
Changes of plasmid copy number per cell (a) and bla OXA−23 copy number per plasmid (b) in three lineages during evolution. The data are presented as mean values of the copy numbers from three independent experiments for each population at the corresponding time point. Error bars depict the standard deviation of the mean, and the dots represent the data of each experiment. Ancestor, ATCC 17978/pAZJ221; L, lineage