
FIGURE 8.
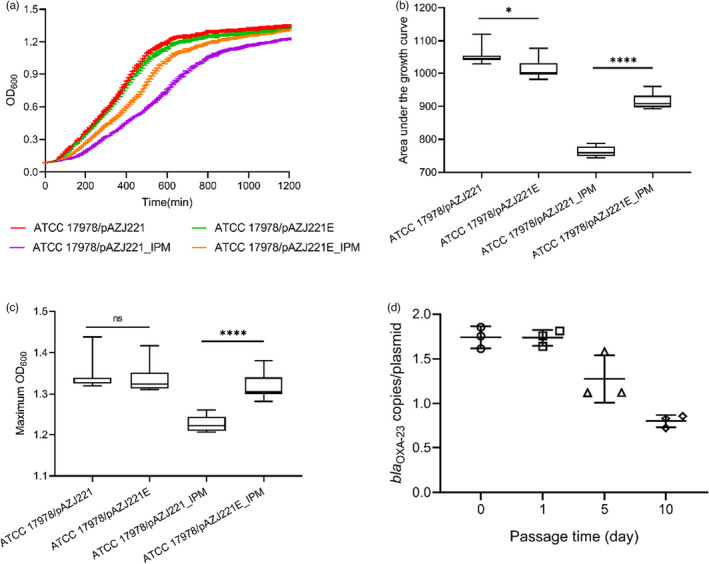
Growth curve (a), the area under the curve (b), and the maximum OD600 (c) of ATCC 17978/pAZJ221 and ATCC 17978/pAZJ221E in MH broth and 16 mg/L imipenem MH broth (IPM) are analyzed and compared. Statistical analyses were performed through unpaired t‐tests. When the data did not follow normal distribution, Mann–Whitney test was performed. *p < 0.05; ****p < 0.0001; ns, not statistically significant. (d) bla OXA–23 copy number per plasmid in ATCC 17978/pAZJ221E on four time points during propagation in antibiotic‐free MH broth. The copy number is monitored using qPCR, and three biological replicates are included. Error bars depict the standard deviation of the mean, and the dots represent the data of each replicate