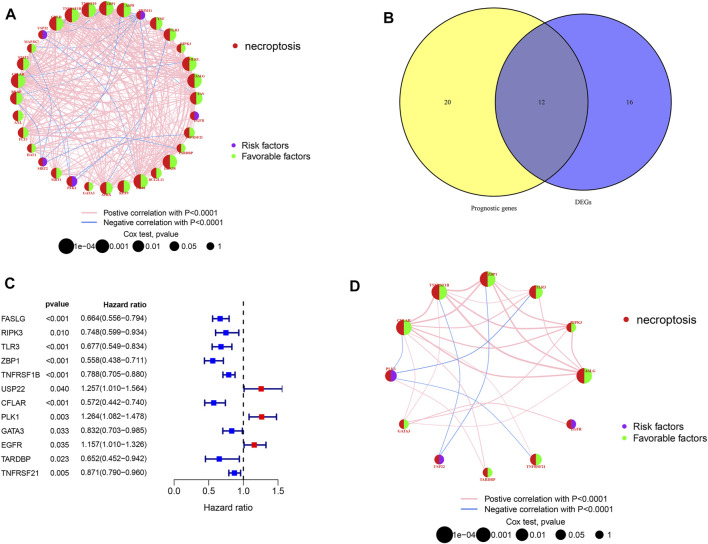
FIGURE 2.
Candidate prognostic DEGs identification in TCGA-SKCM. (A,D) Interactions between prognostic NRGs and prognostic DEGs in SKCM. The lines connecting the NRGs represent the correlations, and thicker lines represent larger correlations. Pink and blue represent positive and negative correlations. (B) Venn diagram of NRGs identified by univariate Cox analyses and differential expression. (C) Forest plots of correlations between 12 NRGs and OS of patients in TCGA cohort.

