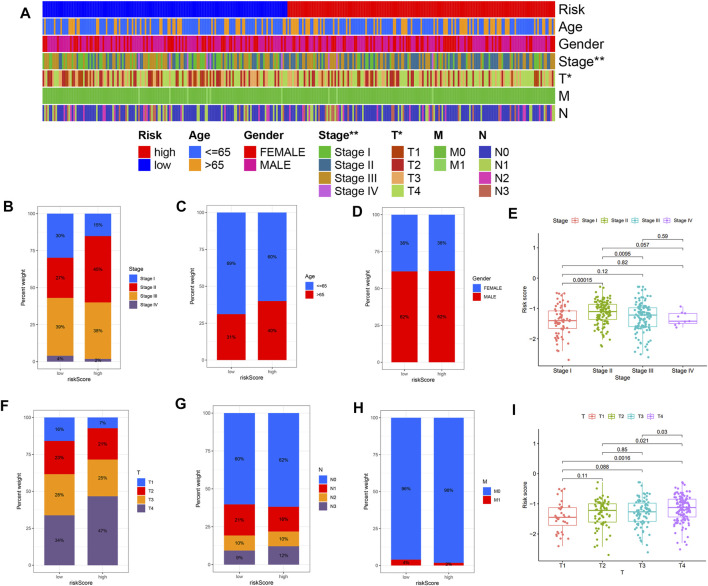
FIGURE 5.
The risk score and clinicopathological characteristics’ correlation. (A) The heatmap shows the clinicopathological features distribution between the two risk subgroups. (B) Risk score distribution stratified by (B) tumor stage, (C) age, (D) gender, (F) T stage, (G) N stage, and (H) M stage. (E,I) The distribution of risk scores according to tumor stage and T stage. *p <0.05, **p <0.01 and ***p <0.001.

