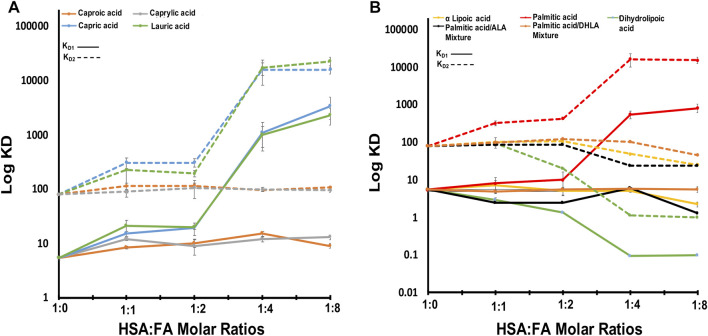
FIGURE 2.
The obtained KD1,2 of HSA-FAs complexes compared to free HSA. (A) The KD values of HSA in complex with caproic acid, capric acid, caprylic acid, and lauric acid. (B) The KD values of HSA in complex with α lipoic acid, palmitic acid, dihydrolipic acid, palmitic and α lipoic acid mixture, and palmitic and dihydrolipic acid mixture. KD1 is indicated with solid lines and KD2 is indicated with dotted lines. Error bars represent standard deviation (SD).

