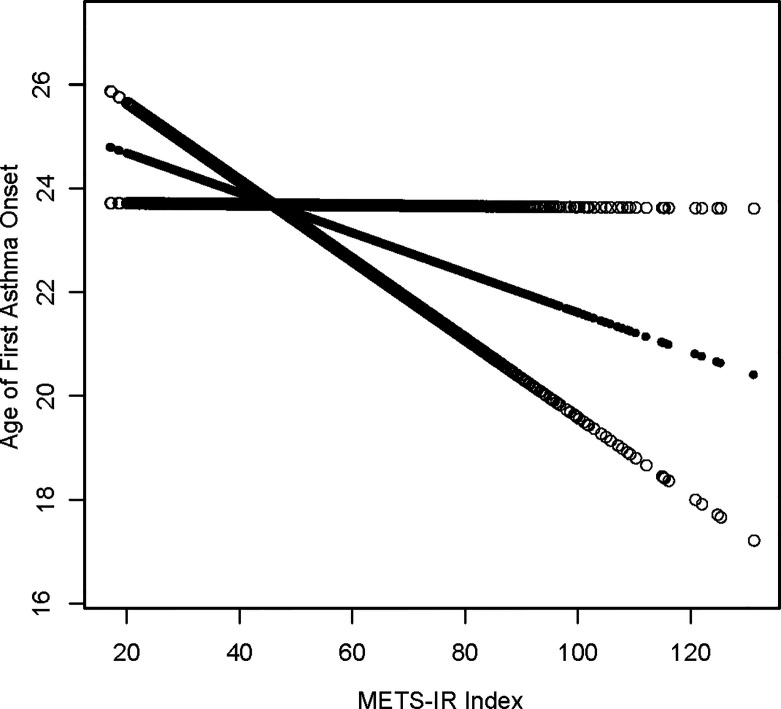
Figure 2.
Density dose-response relationship between METS-IR index with onset age of prevalence. The area between the upper and lower dashed lines is represented as 95% CI. Each point shows the magnitude of the METS-IR index and is connected to form a continuous line. Adjusted for all covariates except effect modifier.

