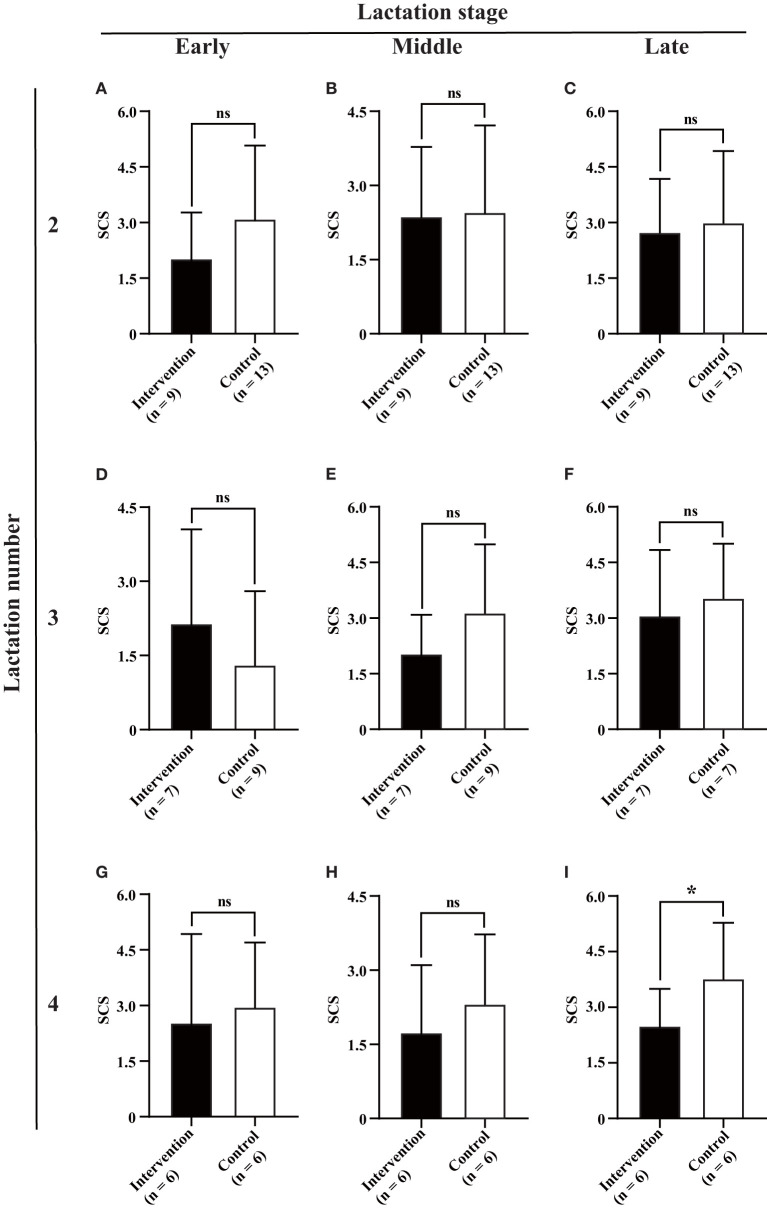
Figure 5.
Association between BLV infection and milk SCS. Average monthly milk SCS (A–I) for each of three lactation numbers (2, 3, and 4) and stages (early, middle, and late) was compared between the intervention (in black) and control (in white) groups by Student's t-test. Data are shown as mean ± SD, and the symbols indicate P ≤ 0.050 (*) and P > 0.050 (ns), respectively.

