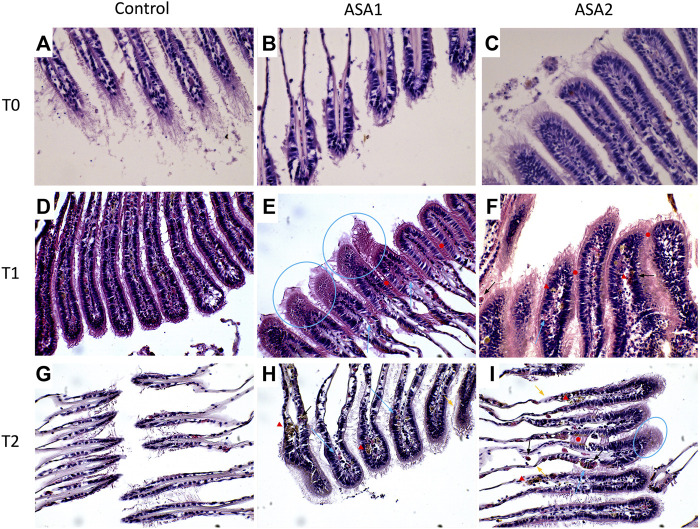
FIGURE 3.
Mytilus galloprovincialis gill sections after ASA exposure. Representative images: (A–C) are, respectively, Control, ASA1, and ASA2, 0-day exposure; (D–F) are, respectively, Control, ASA1, and ASA2, 10-day exposure; (G–I) are, respectively, Control, ASA1, and ASA2, 20-day exposure. ASA1 (ASA 10 μg L−1) and ASA2 (ASA 100 μg L−1). Magnification ×40. Blue arrows highlight hemocyte infiltrations, blue circles highlight vacuolation, red arrowheads highlight lipofuscin aggregates, black arrows highlight granulocyte infiltrations, orange arrows highlight epithelial alterations, and red filled circles highlight lamellar fusion.

