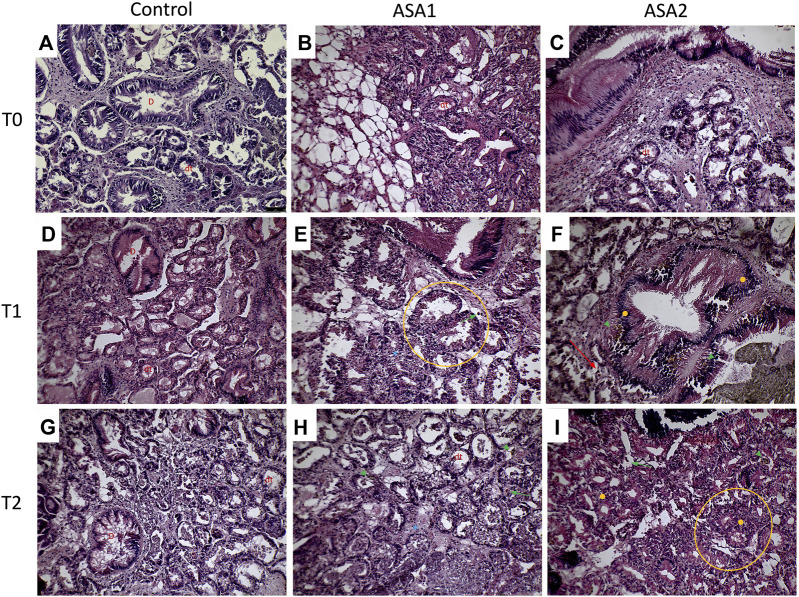
FIGURE 4.
Mytilus galloprovincialis digestive gland sections from ASA exposure: representative figures. (A–C) are, respectively, Control, ASA1, and ASA2, 0-day exposure; (D–F) are, respectively, Control, ASA1, and ASA2, 10-day exposure; (G–I) are, respectively, Control, ASA 1, and ASA2, 20-day exposure. ASA 1 (ASA 10 μg L−1) and ASA2 (ASA 100 μg L−1). Magnification ×20. Orange circles highlight digestive tubule alteration, orange filled circles indicate hyperplasia, red arrows show brown cells, green arrowheads show lipofuscin aggregates, green arrows highlight hemocyte infiltrations, and blue asterisks highlight hypertrophy. D identifies duct; dt identifies digestive tubule.

