FIGURE 2.

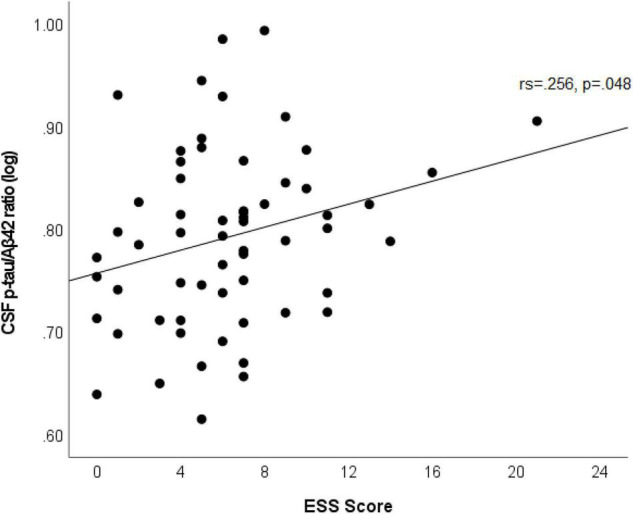
Scatterplot shows an association between ESS scores and log of CSF p-tau/Aβ42 in participants with abnormal ratio (amyloid positive). Best fit line is displayed, with the Spearman’s correlation coefficient and its p-value.

Scatterplot shows an association between ESS scores and log of CSF p-tau/Aβ42 in participants with abnormal ratio (amyloid positive). Best fit line is displayed, with the Spearman’s correlation coefficient and its p-value.