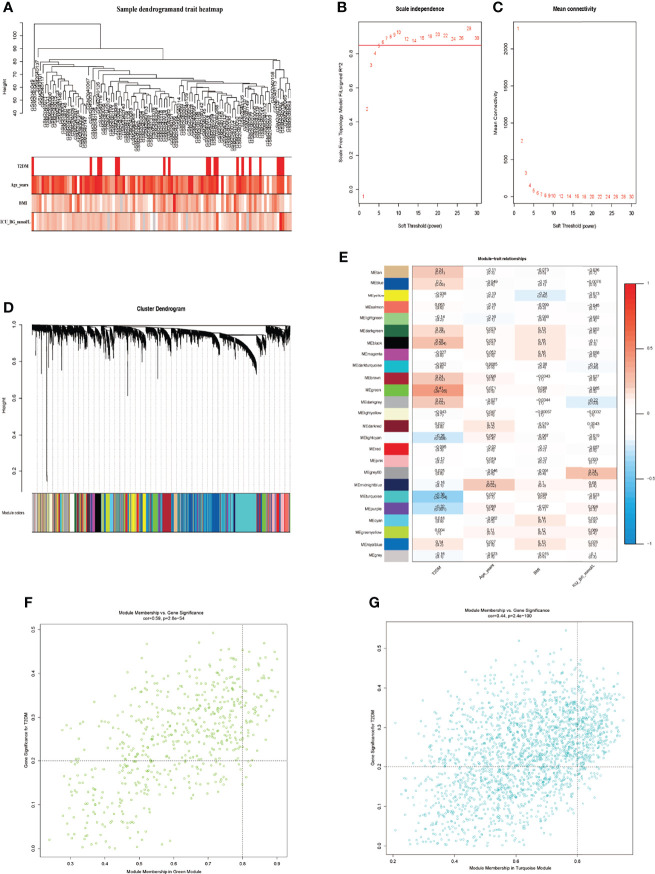
Figure 3.
Screening of key trait-module genes using WGCNA. (A) Sample clustering tree and phenotypic heatmap. (B) The analysis of scale-free fit index and various soft-threshold powers. (C) The analysis of mean connectivity and soft-threshold powers. (D) Dendrogram clustered using Dynamic Tree Cut algorithm. (E) The relationships of different modules and traits. (F) The analysis of green module genes and T2DM. (G) The analysis of turquoise module genes and T2DM.

