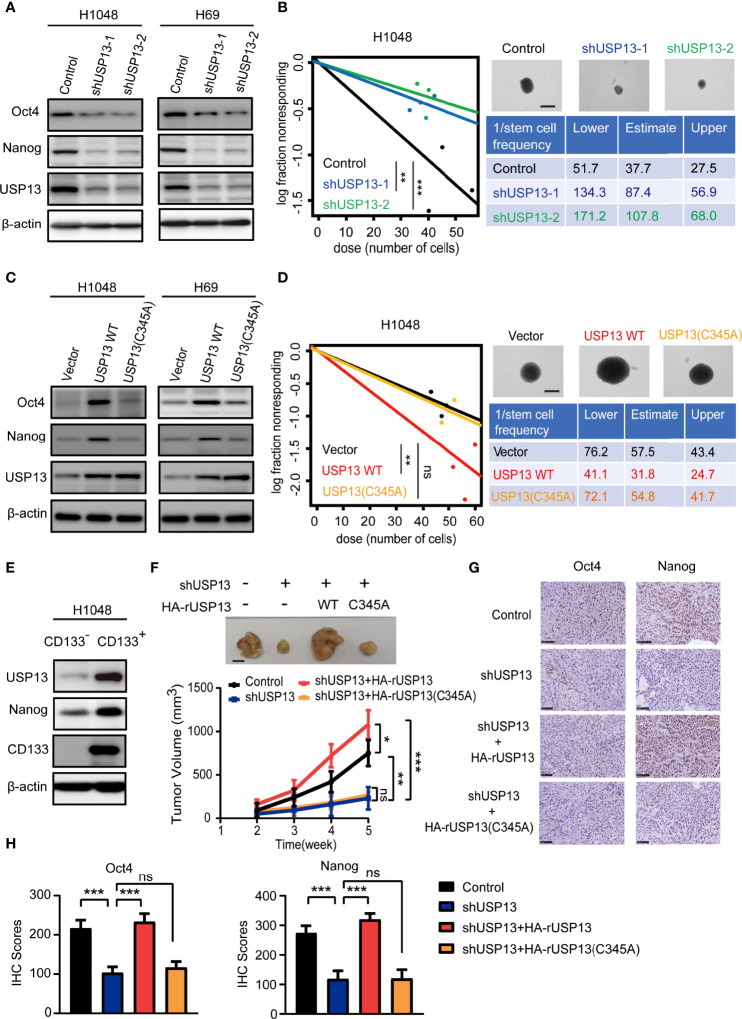
Figure 2.
USP13 promotes SCLC CSC-like properties and tumor growth. (A) Immunoblot analyses of H1048 (left) and H69 (right) cells with or without USP13 depletion were performed with the indicated antibodies. (B) Left: ELDA was performed in H1048 cells with or without USP13 knockdown. Representative sphere images (top right) and stemness frequency illustration of the cells with the upper and lower 95% confidence intervals (bottom right) are shown. Scale bars, 50 μm. Data represent the means ± SD of wells. Two-tailed student’s t-test was used. **p < 0.01, ***p < 0.001. (C) Immunoblot analyses of H1048 (left) and H69 (right) cells with or without WT USP13 or catalytically inactive USP13 (C345A) mutant overexpression were performed with the indicated antibodies. (D) Left: ELDA was performed in H1048 cells with or without WT USP13 or catalytically inactive USP13 (C345A) mutant overexpression. Representative sphere images (top right) and stemness frequency illustration of the cells with the upper and lower 95% confidence intervals (bottom right) are shown. Scale bars, 50 μm. Data represent the means ± SD of wells. Two-tailed student’s t-test was used. ns, not significant. **p < 0.01. (E) CD133- and CD133+ subpopulations of H1048 cells were sorted. Immunoblot analyses were performed with the indicated antibodies. (F) Tumor formation in immunodeficient mice transplanted with H1048 cells with or without USP13 depletion, or shUSP13 cells combined with reconstituted expression of WT HA-rUSP13 or catalytically inactive HA-rUSP13 (C345A) mutant. Tumor sizes and volumes were measured and calculated (n=5 per group). Data represent the means ± SD of five mice per group. Two-tailed student’s t-test was used. ns, not significant. *p < 0.05, **p < 0.01, ***p < 0.001. (G, H) IHC staining of mouse tumor tissues was performed with the indicated antibodies. Representative images are displayed (G), and IHC scores were calculated (H). Scale bars: 100 μm. Data represent the means ± SD of triplicate samples. Two-tailed student’s t-test was used. ns, not significant. ***p < 0.001.

