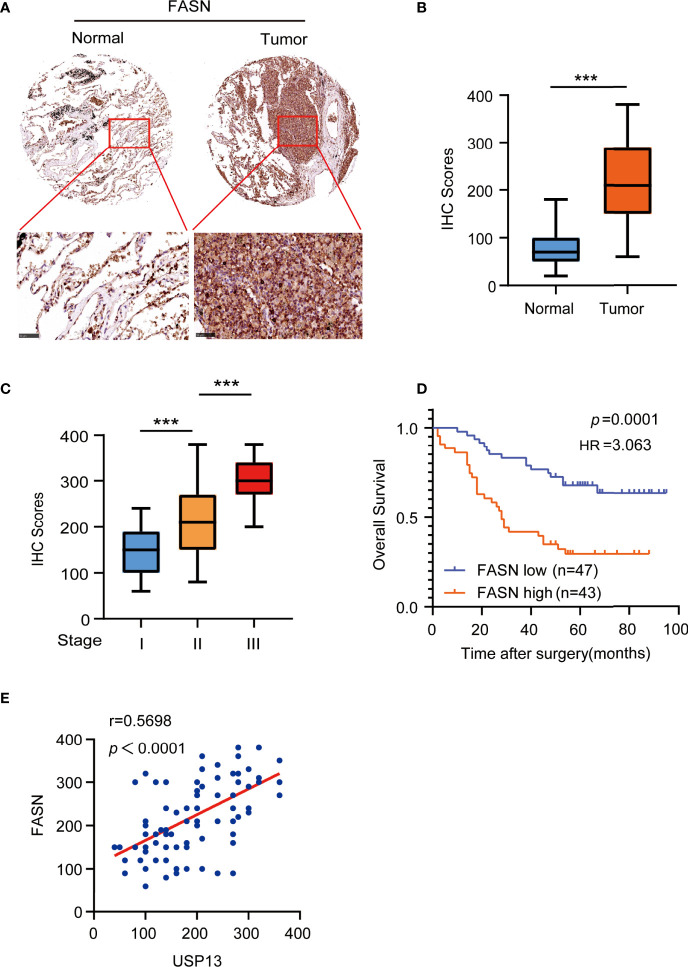
Figure 5.
FASN is positively correlates with USP13. (A, B) Representative images (A) of IHC staining for FASN protein on tissue microarray (TMA) composed of SCLC tumor specimens (T) with their adjacent normal tissues (N). IHC score (B) was calculated. Scale bars: 100 μm. Data represent the means ± SD of samples. Two-tailed student’s t-test was used. ***p < 0.001. (C) FASN expression levels are shown in SCLC patients of different cancer stages. Data represent the means ± SD of samples. Two-tailed student’s t-test was used. ***p < 0.001. (D) Kaplan-Meier plots of the overall survival time of 90 SCLC patients with low or high expression levels of FASN. p values are calculated using a log-rank test (two-tailed). (E) The correlation between USP13 and FASN expression in an SCLC tissue microarray was analyzed using a two-tailed Pearson correlation coefficient.

