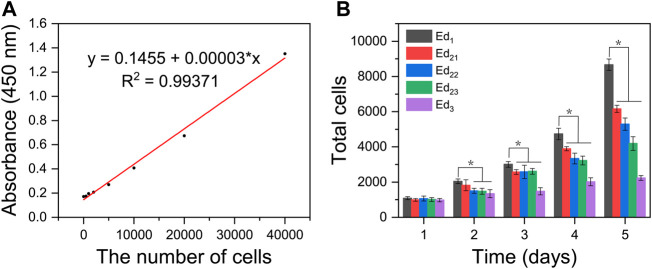
FIGURE 7.
Quantitative analysis of in vitro biological characteristics of scaffolds. (A) Absorbance value at 450 nm of different amounts of MC3T3-E1 cells. (B) Proliferation activity of the adhered MC3T3-E1 cells on different scaffolds after 1, 2, 3, 4, and 5 days of incubation, detected by the CCK8 assay. (n = 7, error bar represents the mean ± SD, * indicates a significant difference compared with Ed1, p < 0.05).

