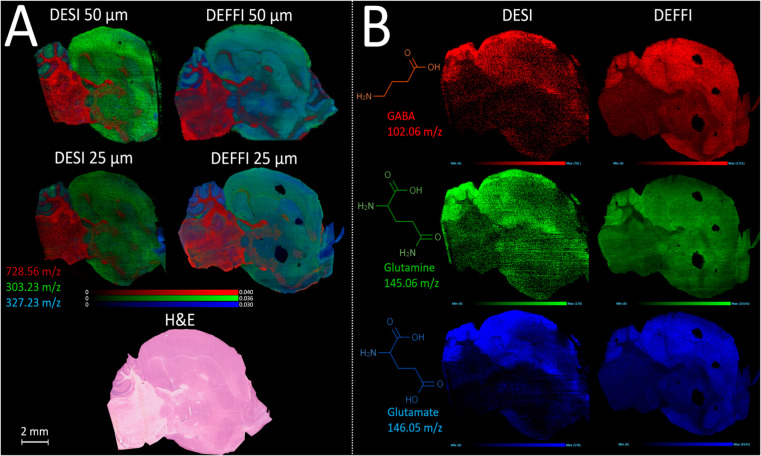
Figure 5.
(A) Overlay ion images of phosphatidylethanolamine PE(O-36:2) 728.56 m/z (red), fatty acid FA(22:6) 327.23 m/z (blue), and fatty acid FA(20:4) 303.23 m/z (green), with a pixel resolution of 50μm (top) and 25μm (bottom), compared between DESI (left) and DEFFI (right), on sagittal sections of a mouse brain, acquired in a negative ion mode. (B) Ion image for 3 low-intensity neurotransmitters in mouse brain: GABA 102.06 m/z (red), glutamine 145.06 m/z (green), and glutamate 146.05 m/z (blue), compared between DESI and DEFFI, on a mouse brain with a pixel resolution of 25μm.

