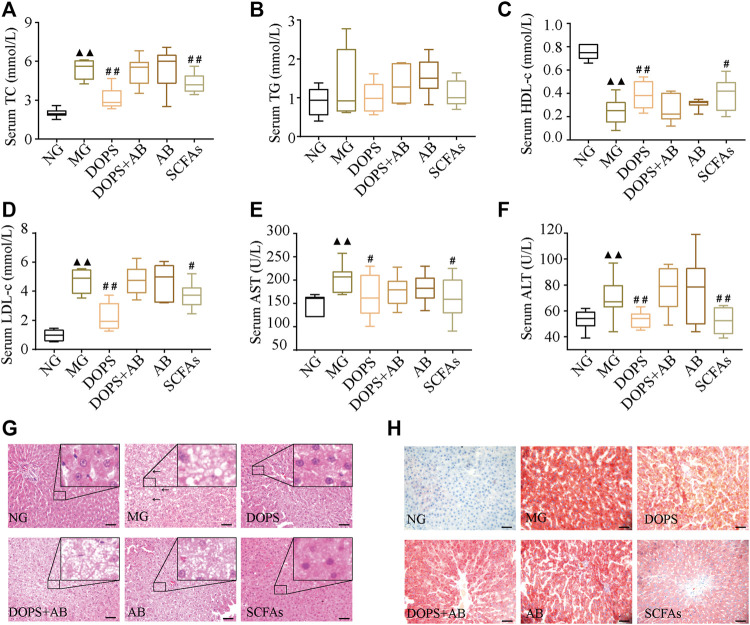
FIGURE 3.
Effect of DOPS on blood lipids and liver function in the MH rats. (A) Changes in serum total cholesterol (TC) after administration. (B) Changes in serum triglyceride (TG) after administration. (C) Changes in serum high-density lipoprotein cholesterol (HDL-c). (D) Changes in serum low-density lipoprotein cholesterol (LDL-c). (E) Changes in serum aspartate transaminase (AST) after administration. (F) Changes in serum alanine transaminase (ALT) after administration. (G) Representative graphs of liver hematoxylin and eosin (H&E) staining (× 400). (H) Liver Oil Red O staining (× 400) representative graph. Bar = 50 μm. NG, normal control group; MG, model control group; DOPS, Dendrobium officinale polysaccharide; DOPS + AB, Dendrobium officinale polysaccharide + antibiotics; AB, antibiotics; SCFAs: short-chain fatty acids. The black arrows indicate liver lesions in the model control group. Compared with the normal control group, ▲ p < 0.05 and ▲▲ p < 0.01; compared with the model control group, # p < 0.05 and ## p < 0.01 (n = 10).

