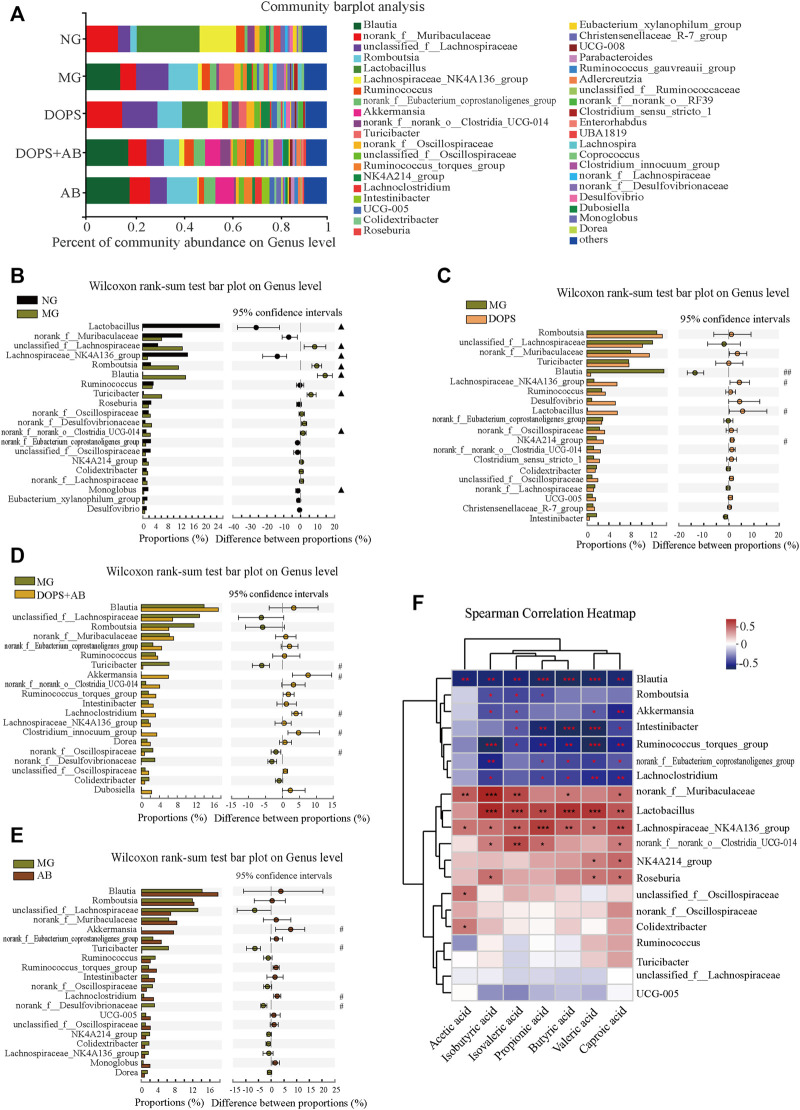
FIGURE 8.
Effect of DOPS on the genus level of intestinal flora and the correlation with SCFAs in the MH rats. (A) Percent of community abundance on genus level. (B–E) Analysis of the difference of the top 20 of intestinal flora abundance between NG and MG, MG and DOPS, MG and DOPS + AB, and MG and AB on genus level. (F) Spearman correlation heat map analysis of intestinal flora composition and short-chain fatty acids (SCFAs) on genus level. NG, normal control group; MG, model control group; DOPS, Dendrobium officinale polysaccharide; DOPS + AB, Dendrobium officinale polysaccharide + antibiotics; AB, antibiotics. Compared with the normal control group, ▲ p < 0.05 and ▲▲ p < 0.01; compared with the model control group, # p < 0.05 and ## p < 0.01; the correlation * p < 0.05, ** p < 0.01, and *** p < 0.001 (n = 3–4).

