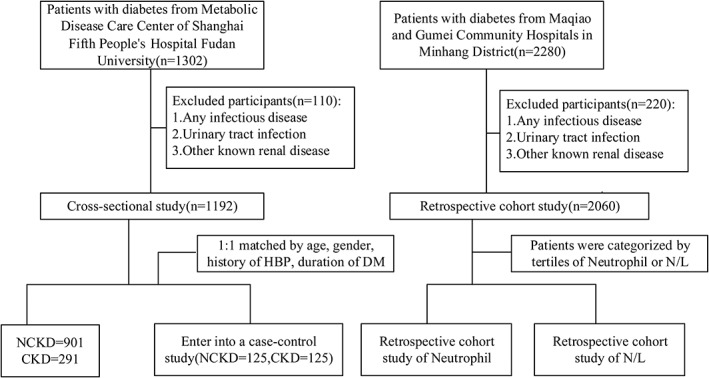
FIGURE 1.

Flow chart of this study. CKD, chronic kidney disease; DM, diabetes mellitus; HBP, high blood pressure; NCKD, without chronic kidney disease; N/L, netrophil‐to‐lymphocyte ratio

Flow chart of this study. CKD, chronic kidney disease; DM, diabetes mellitus; HBP, high blood pressure; NCKD, without chronic kidney disease; N/L, netrophil‐to‐lymphocyte ratio