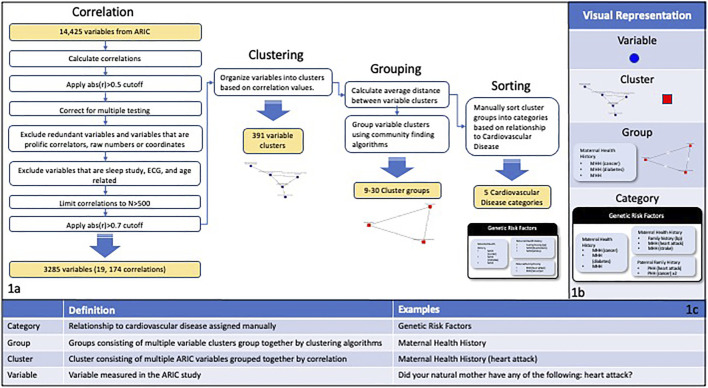
FIGURE 1.
(A) Depicts the correlation, filtering, and clustering process applied to the 14,425 variables in the ARIC study. The variable correlations were calculated and then multiple filtering steps were performed including filtering by cutoff and N values, correcting for multiple testing, and excluding specific categories of variables. The variables were organized into clusters of interconnected nodes based on the filtered correlation values, resulting in 391 variable clusters. The average distance between variable clusters was calculated and clusters were grouped using community finding algorithms. The cluster groups were manually sorted into categories based on the main goals of the ARIC study. (B) Visual representations of the different levels of organization used in this study. (C) A chart showing definitions and examples for the different levels of organization used in this study.

