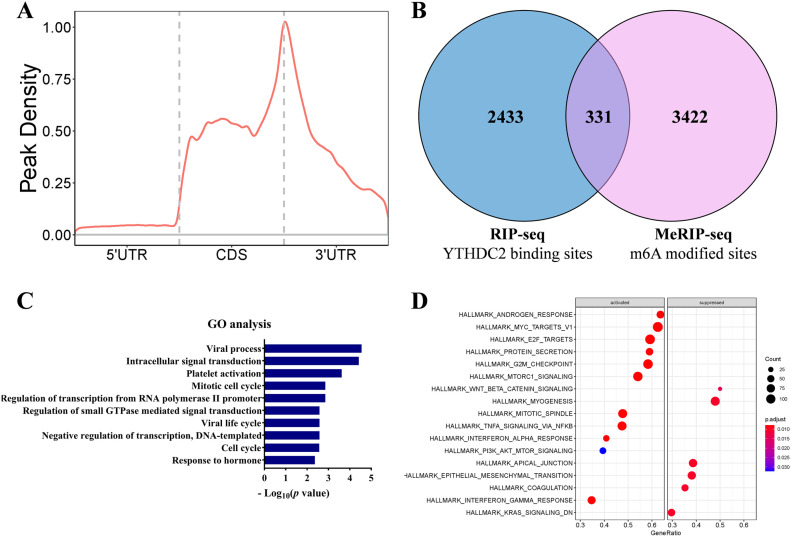
Figure 4.
The biological pathways influenced by YTHDC2: (A) distribution of m6A peaks across the length of mRNAs in RKO, (B) Venn diagram showing overlap of the target genes of RIP-seq and MeRIP-seq (triple repetition), (C) GO analysis of the overlap targets using David (https://david.ncifcrf.gov/), and (D) GSEA based on TCGA database. The median expression value was taken as the cut-off value and divided the patients into high YTHDC2 group and low YTHDC2 group.

