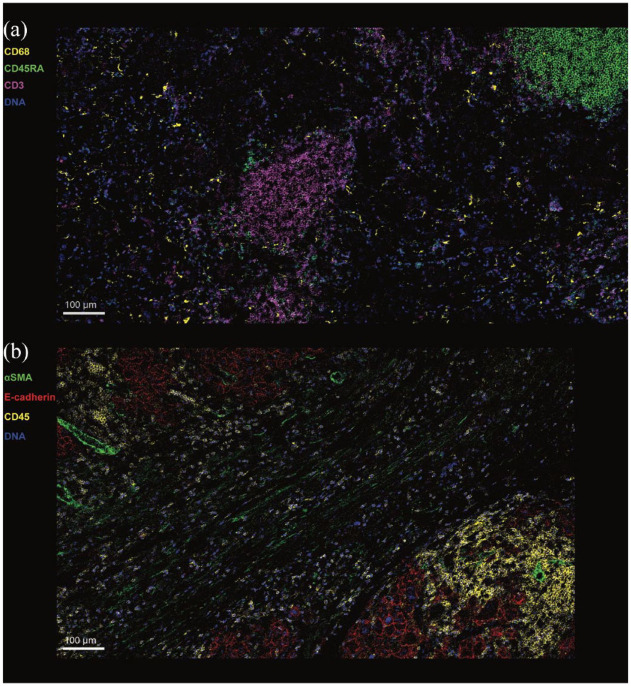
Figure 1.
Imaging mass cytometry of Hepatocellular carcinoma liver.
Complex immune microenvironment in HCC. Imaging mass cytometry was used to visualise the immune landscape of HCC. (a) Reveals a cluster of CD3+ T cells (purple) in the centre of the image and another cluster of B cells (green) in the top right corner of the image. By contrast, CD68+ macrophages (yellow) are seen dispersed throughout the tumour. (b) Combination of immune, stromal and adhesion molecule markers reveals two tumour nodules (top left corner and bottom right corner) with a fibrous band between the two. Within the tumour nodules, hepatoma cells are expressing E-cadherin (red). CD45+ immune cells (yellow) are seen predominantly not only within the tumour nodules but also in the fibrous band. αSMA expression (green) is seen on the vascular structures within the tumour nodules and in the stroma of the fibrous band.

