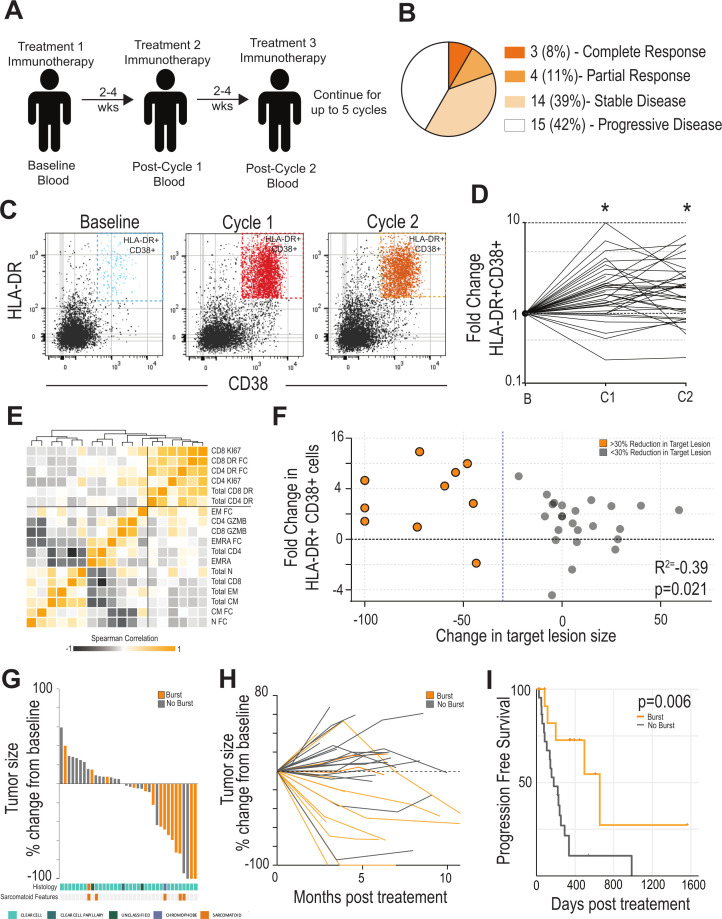
Figure 1.
Expansion of HLA-DR +CD38+CD8 T cells after checkpoint immunotherapy (IO) is predictive of response in patients with RCC. (A) Study Design. Patients with metastatic RCC receiving checkpoint immunotherapy were recruited. Blood was collected at baseline and at each treatment interval. Blood was assessed for various immune parameters over the course of treatment. (B) Clinical response. Patients were assessed for clinical outcome using RECIST criteria. Data shown indicates outcomes for the cohort of 36 patients. (C) HLA-DR and CD38 expression by CD8 T cells during treatment. Blood was analyzed by flow cytometry. Flow plots shown are gated on CD8 +T cells and show the expression of HLA-DR and CD38 by these cells. (D) Fold change in HLA-DR +CD38+CD8 T cells after treatment. Baseline was set as the untreated level for each patient, and fold change in these cells expressed versus this time point. * Indicates paired t-test <0.05 versus baseline. (E) Correlation of various T-cell parameters in blood. Heatmap shows pairwise correlation of each parameter measured. Squares with darker orange have similar fold changes in this parameter from baseline to cycle 1. Order of parameters are based on similarity clustering by Euclidean distance. (F) Correlation with burst of HLA-DR +CD38+T cells and change in tumor size. Patients in orange are those with at least a 30% reduction in the target lesion. Patients in gray are those with less than a 30% reduction in the target lesion. (G) Waterfall plot. Target lesions were assessed by a pathologist and waterfall plots show the greatest change at any time point during the treatment. Patients with a >2.7-fold increase in HLA-DR +CD38+ cells are highlighted in orange. Patients with a <2.7-fold increase in HLA-DR +CD38+ cells are shown in gray. Histologic subtypes identified in tumor tissue by board-certified pathologists highlighted at the bottom (cyan: clear cell, dark tea: clear cell papillary, green: unclassified, chromophobe: purple). Patients’ tumors exhibiting sarcomatoid features are highlighted in orange beneath histologic subtype. (H) Spider plot showing change in major lesion size over treatment course. Patients underwent scans at 3-month to 6-month intervals. Target lesion was assessed by a pathologist for changes in size during the treatment course. Patients with a >2.7-fold increase in HLA-DR +CD38+ cells (‘burst’) are highlighted in orange, while those with <2.7-fold increase in HLA-DR +CD38+ cells (‘no burst’) are shown in gray. (I) Progression-free survival in patients with or without an increase in HLA-DR +CD38+ cells: Patients were stratified into above (n=14) or below (n=22) the 2.7-fold increase in HLA-DR +CD38+ cells after treatment. Initiation of IO was set as starting point for survival analysis. RCC, renal cell carcinoma; RECIST, Response Evaluation Criteria in Solid Tumor.

