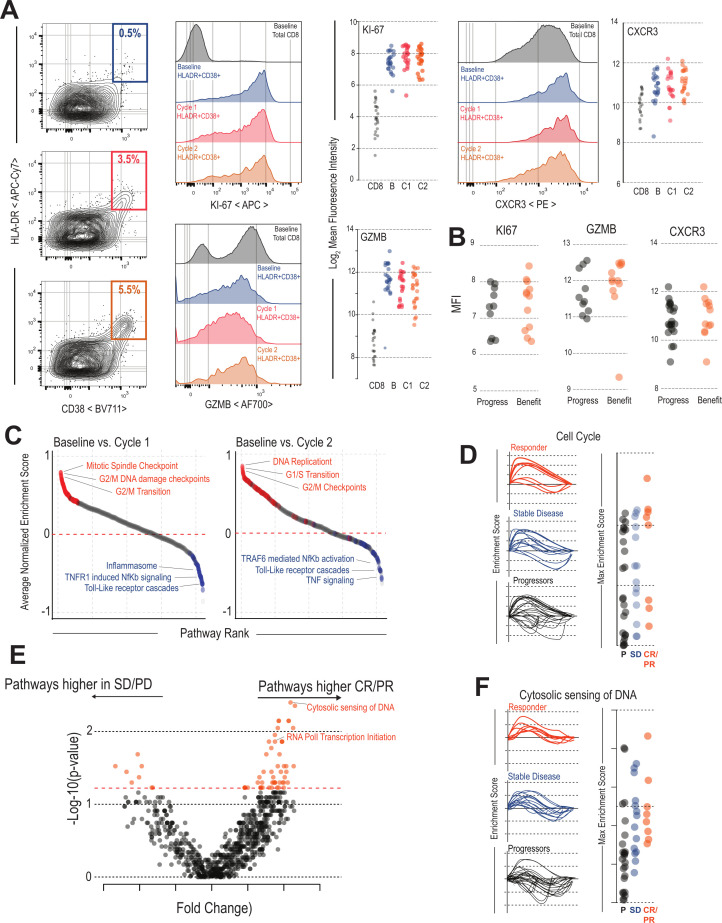
Figure 2.
Transcriptional and phenotypic characteristics of HLA-DR +CD38+CD8 T cells during immunotherapy: (A) Flow cytometry analysis of molecules associated with T cell function. HLA-DR +CD38+ cells expression of Ki67, Gzmb, and CXCR3 at baseline, cycle 1, and cycle 2 of immunotherapy. Total CD8 T cells are shown as a control. Summary plots show MFI of these markers for each patient. (B) HLA-DR +CD38+CD8 T cells are phenotypically similar in patients with and without clinical benefit: HLA-DR +CD38+ cells expression of Ki67, Gzmb, and CXCR3 were measured at cycle 1 in with or without clinical benefit. Plots show MFI of these parameters (n=21). (C) Pathways altered in HLA-DR +CD38+CD8 T cells after checkpoint blockade. Pathway analysis comparing baseline to either cycle 1 or cycle 2 cells was performed for each patient. The average of all patients for each pathway is plotted in order of the pathways most upregulated post-treatment. Highlighted in red are pathways within the top 100 related to cell cycle and blue pathways related to innate inflammation. Selected pathways are listed in plots. (D) Cell cycle response after checkpoint blockade. GSEA plots show the enrichment scores of the cell cycle pathway comparing baseline to either cycle 1 or cycle 2 after checkpoint blockade. Summary plots show most patients had increased cell-cycle activity compared with baseline and there was no significant difference between patients with different immunologic outcomes. (E) Pathway analysis comparing patients with and without objective response. GSEA for all REACTOME pathways was performed on all samples comparing HLA-DR +CD38+ cells from baseline to either cycle 1 or cycle 2 cells. The enrichment scores for each pathway were then compared between patients with and without objective response as defined by RECIST criteria. Volcano plot shows the pathways most significantly activated or deactivated in patients with objective responses. (F) Cytosolic sensing of DNA after checkpoint blockade. GSEA plots show the enrichment scores of the Cytosolic sending of DNA pathway comparing baseline to either cycle 1 or cycle 2 after checkpoint blockade. This pathway is highly related to interferon signaling and includes many molecules related to this process. This pathway is significantly upregulated in the HLA-DR +CD38+T cells of patients with clinical benefit after checkpoint blockade. CR, complete response; PR, partial response; PD, progressive disease; RECIST, Response Evaluation Criteria in Solid Tumor; SD, stable disease; GSEA, gene set enrichment analysis; MFI, mean fluorescence intensity.

