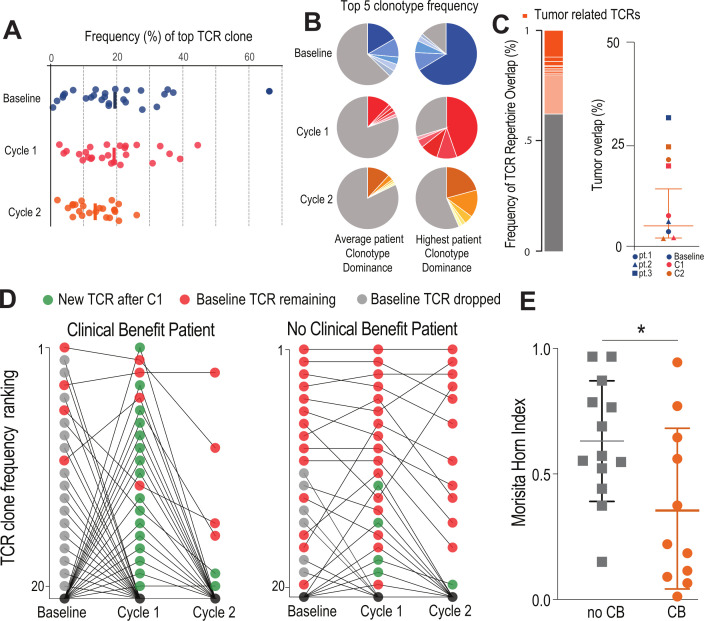
Figure 3.
Patients with clinical benefit have a burst of new TCR clonotypes: (A) HLA-DR CD38+CD8 T cells are clonally expanded. Plot shows the frequency distribution of the dominant TCR clone of circulating activated CD8 T cells (HLA-DR+CD38+) at baseline and after each cycle of therapy (n=26). (B) Clonotype distribution of HLA-DR+CD38+CD8 T cells. Example circle graphs for patients with average (left,~20%) and highest (right) TCR clonotype dominance among their activated circulating CD8 T cells. Shown in different shades of each color are the top five TCR clonotypes in the same patient at each time point. (C) Frequency of TCR repertoire overlap between circulating CD8 T cells before/after therapy and tumor infiltrating CD8 T cells at the time of surgery. Representative proportion of the detected TCR repertoire in circulating CD8 T cells that is unique (gray) or overlapping (orange) with tumor infiltrating CD8 T cells at the time of surgery. Summary of TCR repertoire overlap with primary tumors at the time of surgery for three patients at three time points. Shapes denote a single patient while colors represent the time point at which the samples were collected. (D) Dynamic clonotype rank in responding patients after treatment. Plots show how the top 20 TCR clones present at baseline change over the treatment time course in a representative patient with and without clinical benefit. In the representative patient with clinical benefit, 16 of the top 20 clonotypes are replaced by new TCR clones after the first treatment (green). (E) Similarity of TCR clonotypes from baseline to treatment is significantly different in patients with clinical benefit. Morisita-Horn index was used to quantify the similarity between the different therapy cycles within each individual patient. Mean and SD are shown. *P<0.05 determined by unpaired Welch’s t-test. CB, clinical benefit; TCR, T-cell receptor.

