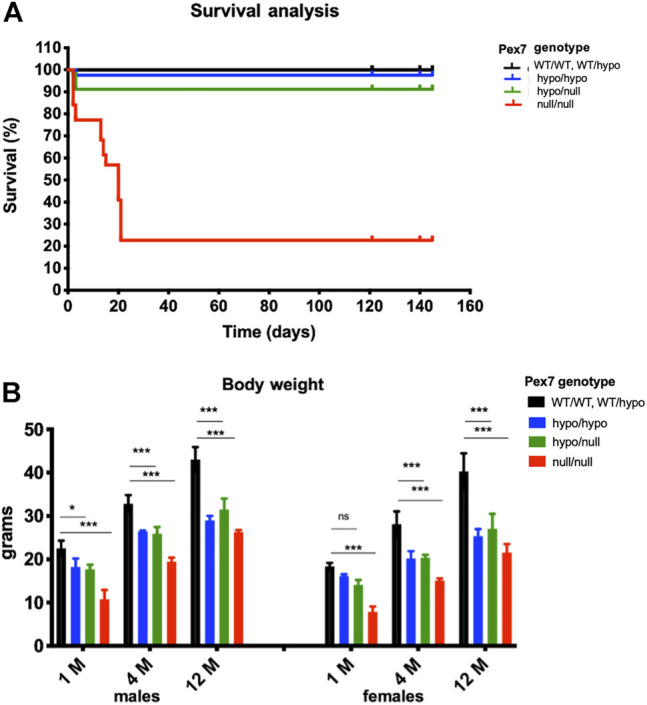
FIGURE 3.

Pex7 genotype correlates with survival rates and weight gain. Kaplan–Meier plots showing the percentage of survival of Pex7 deficient mice (n = 41–60 per genotype). Analyzing the survival data by log rank tests showed significant differences between genotypes (p < 0.001) in accordance to the severity of Pex7 genotype (A). Graded and significant reduction in body weight according to Pex7 genotype severity is found in Pex7 mutants compared to controls at 1, 4, and 12 months (M) of age (n = 10–12 per genotype) (B). ns: nonsignificant, *p < 0.05, **p < 0.01, ***p < 0.001, ****p < 0.0001.
