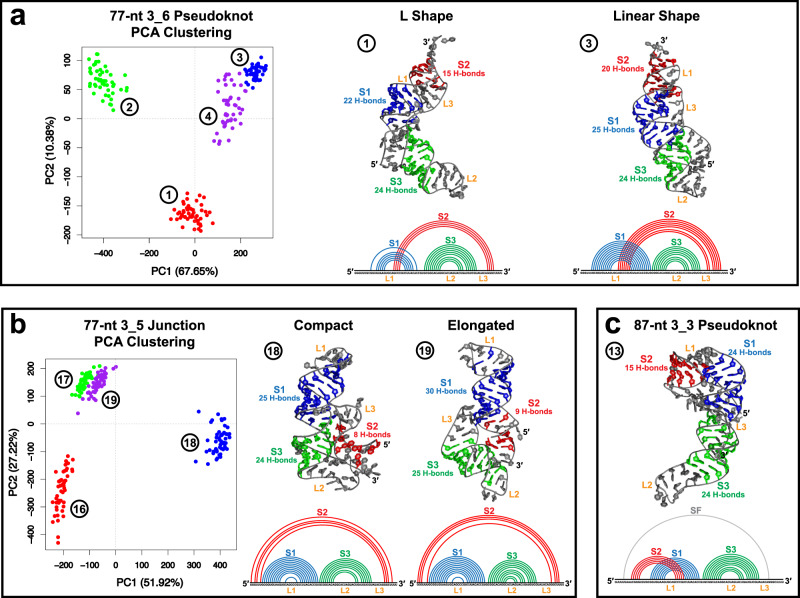
Fig. 2. Clustering analysis and representative structures for the three FSE motifs.
Multi-trajectory clustering is performed to compare the 77-nt 3_6 trajectories (1–4 in Table 1) and select representative systems, as well as the 3_5 trajectories (16-19 in Table 1), with 50 equally spaced frames extracted from each trajectory. a For 3_6, two representative trajectories are chosen, sampling an L and a linear shape, respectively (shown as the largest cluster center structures found by additional single-trajectory clustering, see “Methods”). b For 3_5, the two representative models capture compact and elongated shapes. c For 87-nt 3_3, only one system maintains the motif throughout the MD simulation. The 2D structures are extracted using 3DNA-DSSR67, and the numbers of hydrogen bonds formed in the stems (averaged over the last 500 ns of the simulations) are calculated using Gromacs68.

