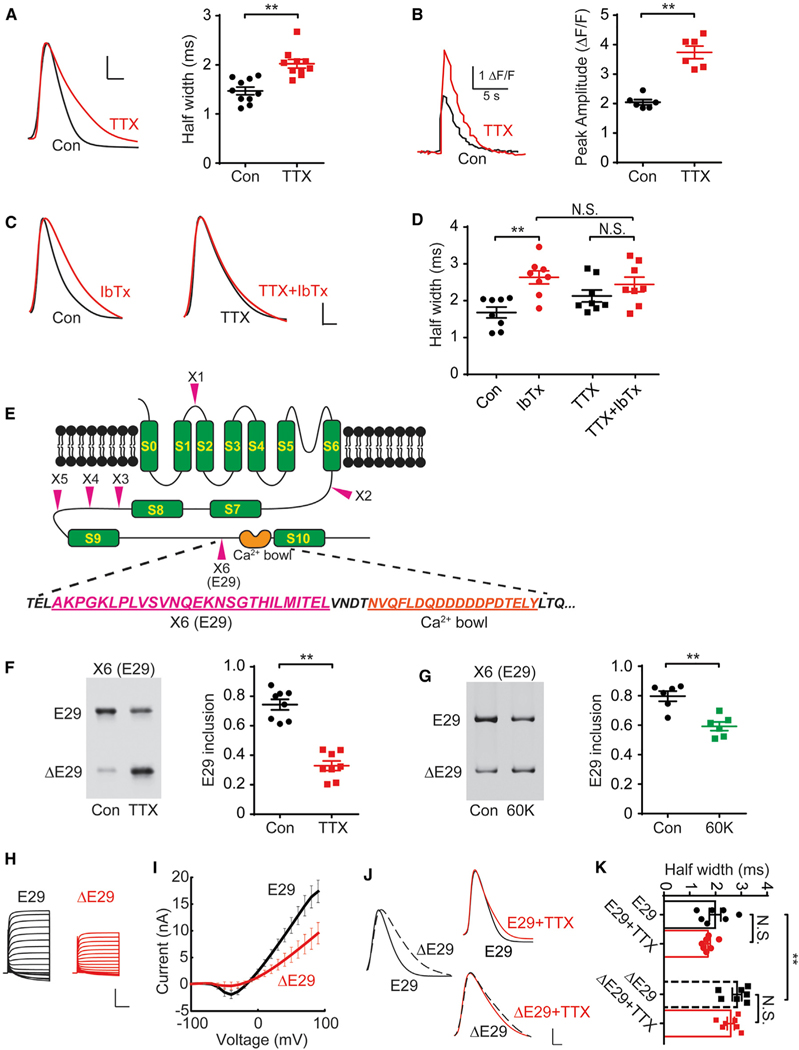
Figure 1. Chronic Spike Blockade-Induced BK Channel AS Is Responsible for Homeostatic Prolongation of AP Duration.
(A) Action potentials (APs) recorded from sham control- or chronic TTX-treated (48 h) neurons (left); AP duration (APD) was measured as half-width (right, n = 10). Scale bars, 20 mV, 1 ms.
(B) Single AP-elicited Ca2+ transients from control or TTX neurons transfected with GCaMP6s (left) and ΔF/F (right, n = 6).
(C) APs recorded from control (left) and TTX (right) neurons with (red) or without (black) IbTx. Scale bar, 20 mV and 1 ms.
(D) Half-widths of APs depicted in (C) (n = 8).
(E) Diagram of BK channel pore-forming α subunit and AS sites (X1–X6, arrowheads) (Pietrzykowski et al., 2008). Amino acid sequences of the sixth exon X6, E29 (purple, underlined), near the “Ca2+ bowl” (orange, underlined).
(F) RT-PCR products from control or TTX cultures with or without E29 inclusion (E29 or ΔE29, left) and percentage of products containing E29 (right; n = 8).
(G) E29 splicing in control or 60 mM K+ (60K)-treated cultures (24 h) and percentage of products containing E29 (right, n = 6).
(H) Whole-cell recordings from HEK293 cells overexpressing BK channel constructs with or without E29.
(I) Corresponding current–voltage (I-V) curves.
(J) APs from control or TTX cortical neurons transfected with plasmids encoding BK channel isoforms with or without E29. Scale bar, 20 mV and 1 ms.
(K) Pooled half-widths of APs depicted in (J) (n = 7).
For (A), (B), (D), (F), (G), (I), and (K), data are represented as mean ± SEM; *p < 0.05; **p < 0.01; N.S. represents p > 0.05.
See also Figures S1–S3.

