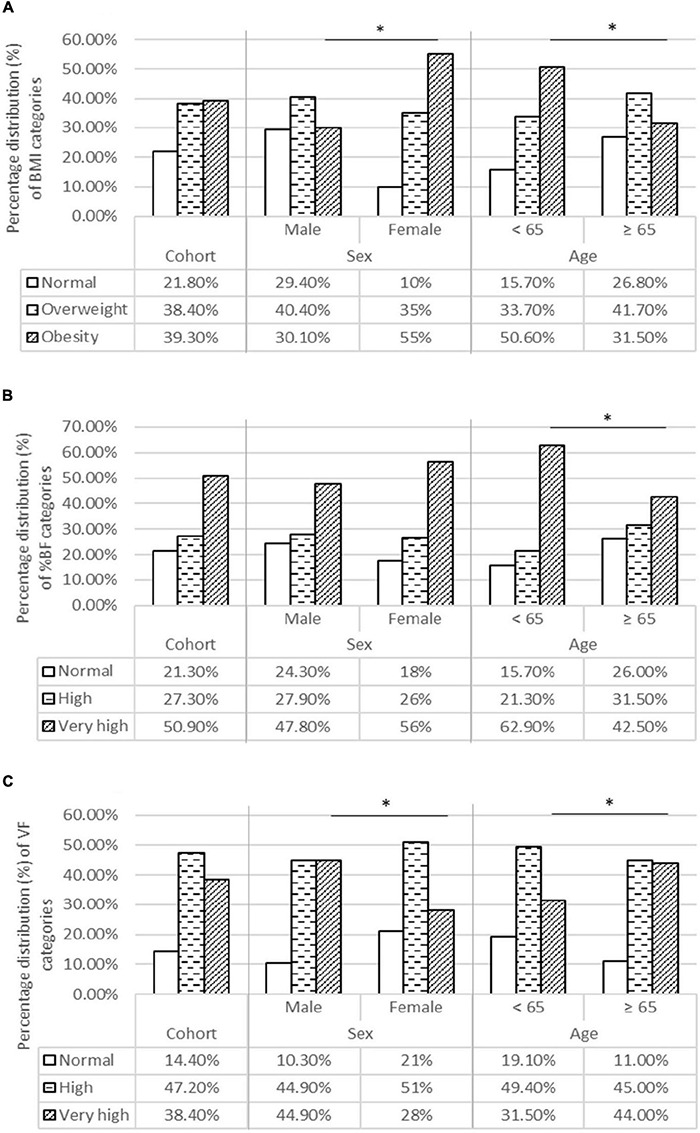
FIGURE 1.

Body composition categories for BMI (A), BF% (B), and VF (C) in the entire cohort and for age and sex categories. (A) Percentage distribution of BMI categories. (B) Percentage distribution of % BF categories. (C) Percentage distribution of VF categories. BF %, Body fat percentage; BMI, Body mass index; VF, Visceral fat. *Statistical significance level is taken for “p” values below 0,05, using the χ2-test.
