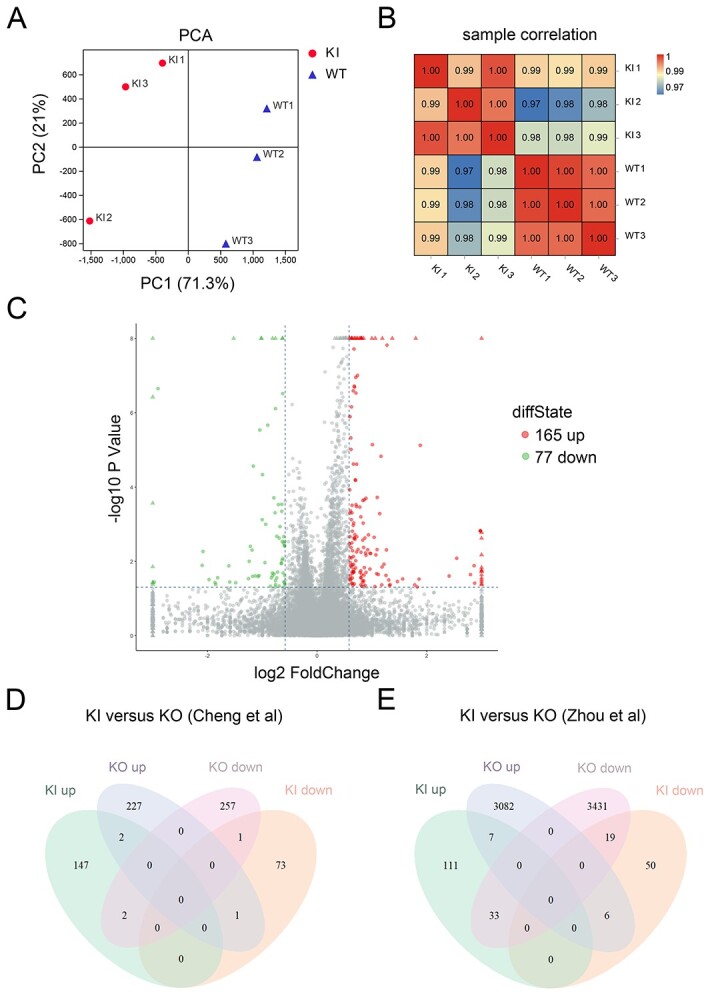
Figure 4.

Dysregulation of transcriptomes in Taf7lD144G/Y mouse testes. The RNA-seq data from WT and Taf7lD144G/Y mouse testes (3 months old) were analyzed for protein-coding transcripts. (A) Principal component analysis of RNA-seq samples from WT and Taf7lD144G/Y testes. Three WT samples: WT1, WT2, and WT3; Three knockin samples: KI1, KI2, and KI3. (B) Pearson’s correlation analysis of RNA-seq samples. (C) Volcano plot of transcript levels between WT and Taf7lD144G/Y testes. The differentially expressed genes are highlighted in red (upregulated in Taf7lD144G/Y testis) or green (downregulated in Taf7lD144G/Y testis). (D) Comparison of differentially expressed coding transcripts in Taf7lD144G/Y testis and with those identified in Taf7l knockout testis [14]. (E) Comparison of differentially expressed coding transcripts in Taf7lD144G/Y testis and Taf7l knockout testis [15].
