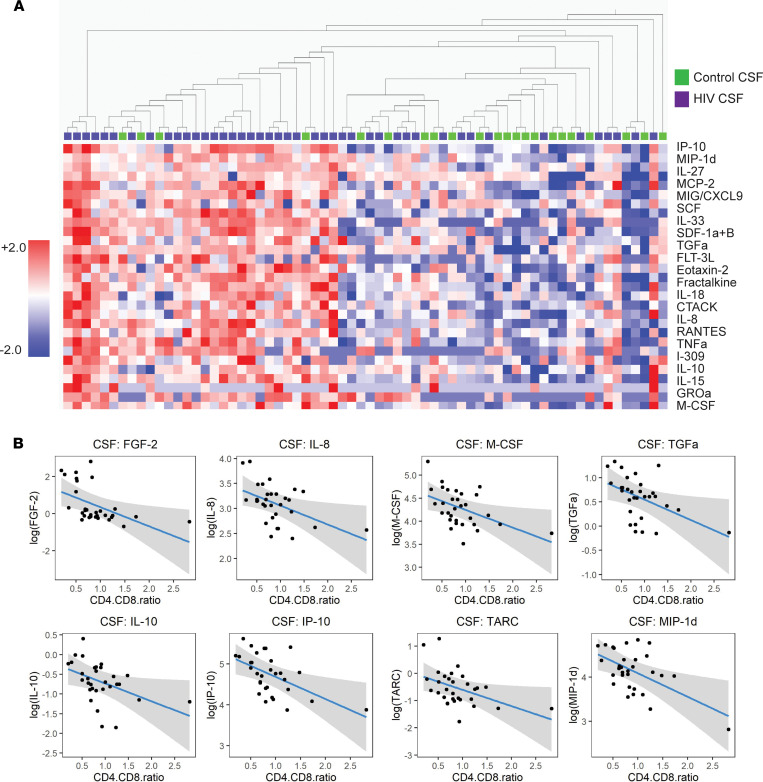
Figure 5. CSF inflammatory cytokines and chemokines are dysregulated in PWH despite ART.
(A) Heatmap demonstrating cytokine levels in the CSF of PWH (purple) compared with uninfected controls (green). Shown is the list of cytokines for which levels in PWH are significantly different from uninfected controls (q < 0.05). Cytokines are ordered by significance (q value), and participants are ordered by hierarchical clustering. Adjusted P value (q) computed by paired t tests and FDR controlled using Benjamini, Krieger, and Yekutieli. (B) Linear regression analysis demonstrating the effect of the CD4/CD8 T cell ratio on CSF cytokines in PWH after controlling for age, race, sex, and history of substance use disorder. n = 44 PWH, n = 22 uninfected controls.

