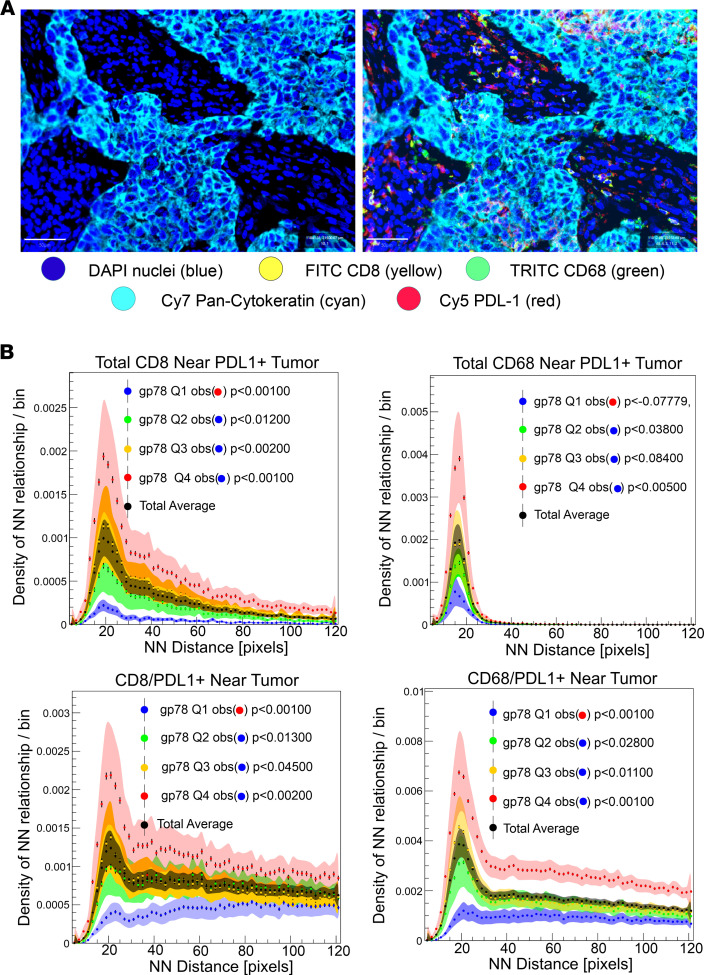
Figure 8. Spatial analysis of the association of gp78 protein expression with proximities of PD-L1–positive CD8, CD68, and tumor cells within the TME.
(A) Multiplex immunofluorescent image of patient tumors stained for CD8, CD68, Pan-cytokeratin, and PD-L1. (B) Distance distribution profiles of proximity frequencies between CD8, CD68, and tumor cells based on their PD-L1 expression. Distances are represented as pixels (11). Scale bar: 50 μm.

