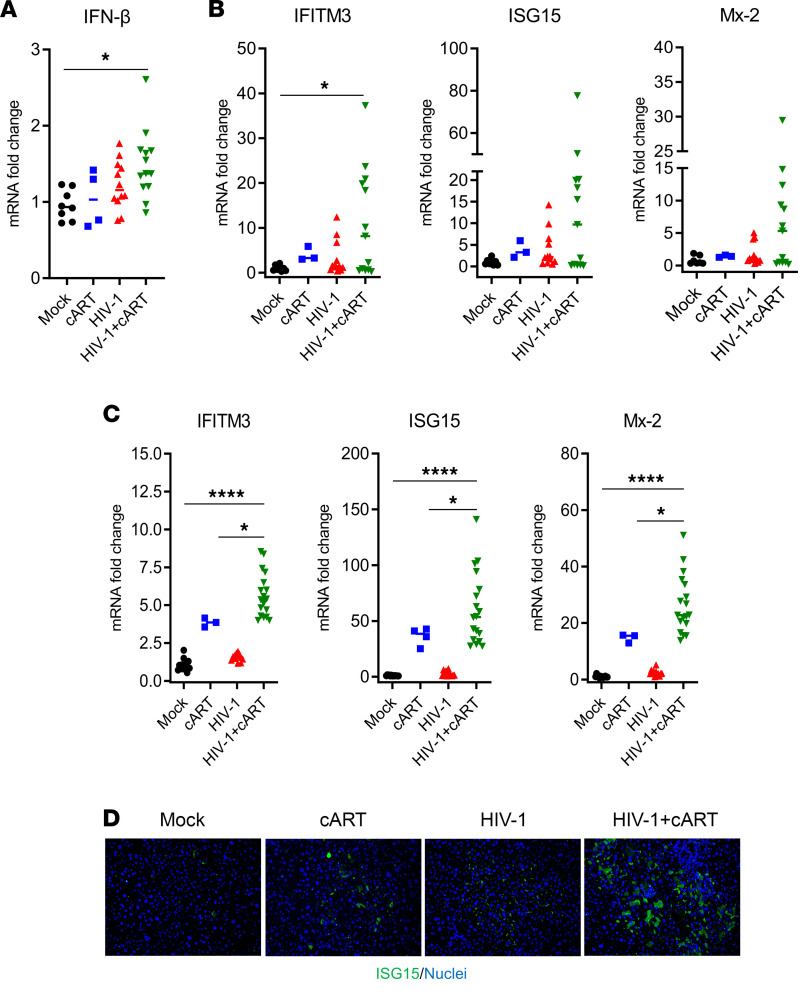
Figure 3. HIV-1 and cART induce IFN-I signaling pathways in the liver of hu-mice.
Expression of ISGs in the livers of NRG-hu mice collected at 12–13 wpi. (A–C) RT-qPCR analysis in the liver of (A and B) human genes (IFN-β, IFITM3, ISG15, and Mx-2) and (C) mouse genes (IFITM3, ISG15, and Mx-2), normalized with mouse Gapdh. (D) Immunofluorescence staining for human ISG15 (green) and nuclei (blue) in the liver of hu-mice (original magnification, ×20). Bars in the scatter plots represent the median value. Statistical analysis was performed with 1-way ANOVA and Turkey’s post hoc test; *P < 0.05; ****P < 0.00005.

