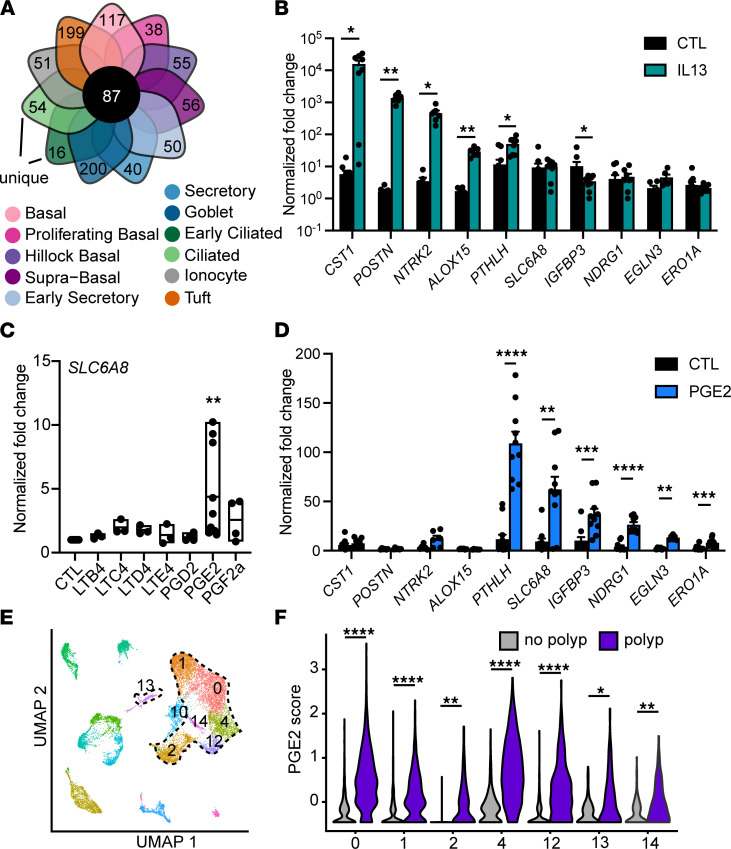
Figure 2. Pan-epithelial gene signatures in nasal polyps are imparted by IL-13 and prostaglandin E2.
(A) Among all DEGs for each cell type, 87 genes were upregulated in at least 9 cell types in polyp epithelium compared with controls and defined as pan-epithelial. (B) Fold change in normalized gene expression for tracheal epithelial cells cultured at air liquid interface (ALI) and stimulated with IL-13 (n = 10 wells from 6 donors, *P < 0.05; **P < 0.01 by ANOVA with Tukey correction). (C) Fold change in normalized SLC6A8 gene expression in human tracheal epithelial cells cultured at ALI and stimulated with indicated eicosanoids (n = 9 donors, **P < 0.01 by ANOVA with Dunnett’s correction). Represents similar responses for all genes as shown in D. (D) Fold change in normalized gene expression for tracheal epithelial cells cultured at ALI and stimulated with prostaglandin E2 (PGE2) (n = 10 wells from 6 donors, **P < 0.01; ***P < 0.001; ****P < 0.0001 by ANOVA with Tukey correction). (E) UMAP of scRNA-Seq data from surgical sinus tissue of participants with CRSwNP (“polyp”) or patients with CRS without nasal polyps (CRSsNP) (“no polyp”) whole polyp or nonpolyp sinus tissue (16). Epithelial clusters encircled with dashed line. (F) PGE2 response gene score in polyp and nonpolyp epithelial clusters. *P < 0.05; **P < 0.01; ****P < 0.0001 by linear mixed model. Statistical calculations relating to this figure are included in Supplemental Table 7. For B and D, data shown as mean ± SEM. For C, horizontal line shows mean with bars indicating range.

