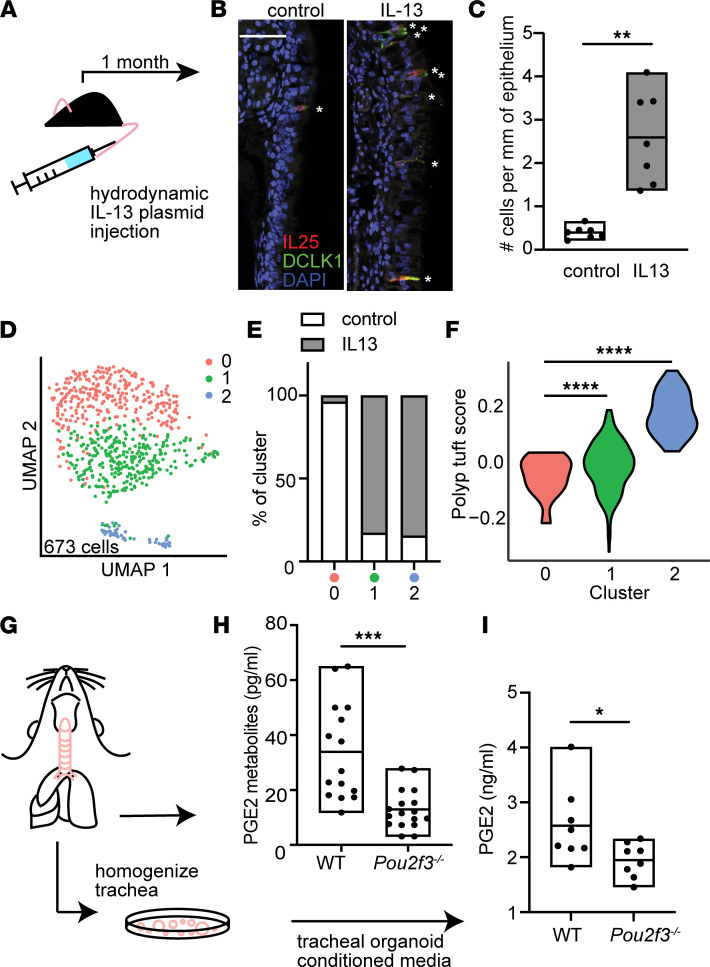
Figure 3. IL-13 expands and programs airway tuft cells toward PGE2 production.
(A) T2 inflammatory mouse model system. (B) Representative sections of mouse nasal epithelium after 1 month of IL-13 overexpression or IgG control. Stars mark dual staining IL-25+ and DCLK1+ tuft cells. Bar indicates 50 μm. (C) Quantification of tuft cells in nasal epithelium in control and systemic IL-13 expression. **P < 0.01 by t test. (D) Subclustering of tuft cells from control or IL-13–overexpressing mouse nasal epithelium. (E) Percentage of tuft cells derived from control or systemic IL-13 conditions in each subcluster in D. (F) Human polyp allergic tuft cell gene score in mouse nasal epithelial tuft cell subclusters. ****P < 0.0001 by linear regression model. (G) Schematic of protocol to measure (H) PGE2 metabolites (PGEMs) in whole tracheal tissue from WT or Pou2f3–/– mice exposed to systemic IL-13 or (I) PGE2 in media from tracheal organoids derived from WT or Pou2f3–/– mice. (H and I) *P < 0.05; ***P < 0.001 by t test. For C, H, and I, line is at mean and bars indicate max/min (range).

