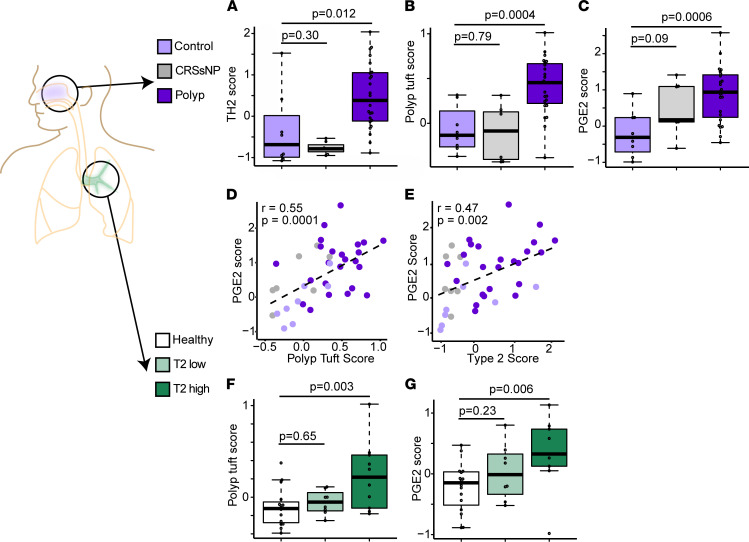
Figure 4. Tuft cell and PGE2 activation are common features of upper and lower allergic airway disease.
(A) T2 (3 gene) score, (B) polyp tuft score, and (C) PGE2 score in RNA-sequenced bulk epithelial brushings from sinus tissue of control patients (light purple) or patients with CRS without asthma or nasal polyps (“CRSsNP”; gray) or CRS with asthma and nasal polyps (“Polyp,” dark purple). (D) Correlation between PGE2 score and polyp tuft cell score in sinus. (E) Correlation between PGE2 score and T2 score in sinus. (A–E) n = 8 control, n = 7 CRSsNP, n = 24 polyp participants, as in Supplemental Table 1. (F) Polyp tuft score and (G) PGE2 score in RNA sequencing of bulk epithelial brushings of the bronchus of healthy participants or asthmatic participants classified as either T2 low or T2 high. (F and G) n = 16 healthy, n = 8 T2 low, n = 11 T2 high. For A–C, F, and G, bars represent 25th–75th percentiles with line at median, error bars indicating range, and whiskers extending from largest value (upper whisker) no farther than 1.5 × IQR from the hinge (where IQR is the distance between the first and third quartiles) to smallest value no farther than 1.5 × IQR (lower whisker).

